
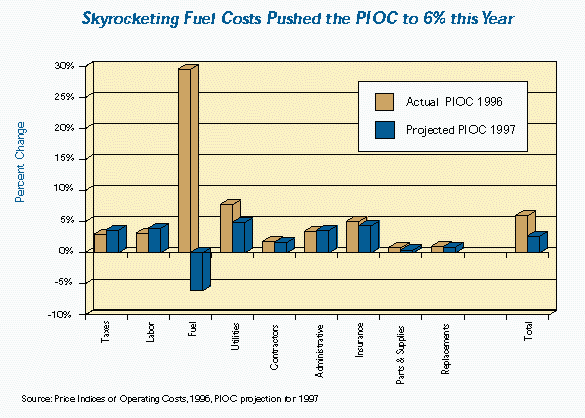
Despite the substantial increase in fuel and utility costs, largely due to aberrant weather conditions, inflation in many other sectors is well under control. The increase in Labor Costs (3.1%) was the lowest since 1976. The rise in the Contractor Services component (1.8%) was the second lowest in eleven years. Administrative Costs rose modestly (3.5%) and show no upward trend. In short, inflation among the labor-based components of the Price Index is very modest. This is important since these components constitute a large part (about 40%) of the PIOC.
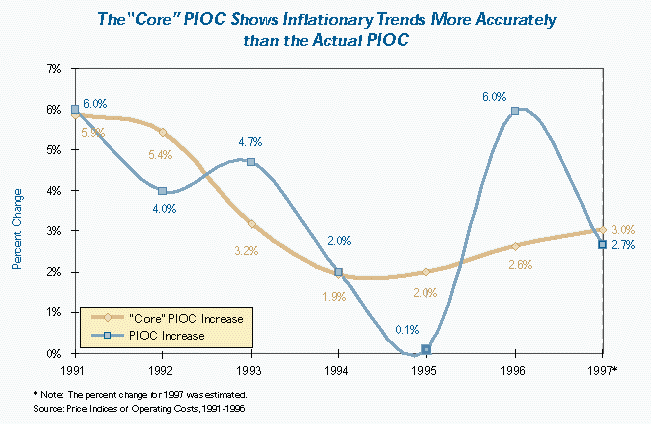
In addition to computing the regular Price Index this year, staff also calculated a "core" PIOC which excludes the erratic changes in fuel oil, natural gas, and electricity costs (see chart). The core PIOC, like the core Consumer Price Index, is useful for analyzing inflationary trends.
After reaching a low of 1.9% in 1994, the "core" rate has been creeping upward the last two years and will probably rise further (to 3%) in 1997. The increase in the core rate of inflation is almost entirely due to increases in real estate taxes and water/sewer fees. In the near future it appears government, not private businessmen, will have the greatest impact on landlords' costs.
The Price Index for Apartments is projected to increase 2.7% next year. Fuel costs will probably decline, the labor-based components (i.e. "Labor", "Contractor Services" and "Administrative Costs") will rise modestly, and government mandated costs (e.g. "Real Estate Taxes", "Water/Sewer Fees") will rise substantially.
Traditionally, RGB staff has computed a "commensurate rent increase" based on the PIOC. The commensurate is the rent increase needed to compensate landlords for increases in O&M costs while maintaining net operating income at a constant level in nominal dollars. Based on this year's increase in the PIOC and next year's PIOC projection, the commensurate is 4% for a one year lease and 5% for a two year lease.

The original PIOC expenditure weights and market basket were devised by the U.S. Bureau of Labor Statistics (BLS) which was retained by the RGB as the PIOC contractor from 1970 to 1981. From 1982 to 1990, the PIOC was prepared by private consulting firms. In 1991, the RGB staff's growing expertise and familiarity made it possible to move the PIOC "in house."
This is the sixth year that the RGB staff has produced the price index and the first year that the index has been undertaken without the assistance of Speedwell Inc. In previous years Speedwell has prepared the tax and water/sewer components of the PIOC. RGB staff's growing computer expertise made it possible to take on these last two elements of the price index.
The PIOC consists of several surveys, each designed to measure changes in one or more types of operating cost. These are described in the following sections of the report.
The sample frame for the owner survey included nearly 40,000 stabilized buildings registered with DHCR in 1994. A stratified sampling scheme was used to choose 6800 addresses from this pool for the owner mailing. The number of buildings chosen in each borough was proportional to the concentration of stabilized buildings in that borough. Roughly 13.5% of the surveys mailed out were returned to the RGB. A total of 435 of these contained information which was used. The number of verified price quotes in 1995 and 1996 for the owner survey is shown in the appendix.
 The tax component is based entirely on real estate taxes. The
change in taxes is estimated by comparing aggregate taxes levied
on rent stabilized apartment houses in FY 1995 and FY 1996 (For
additional detail on how the tax computation compares to last
year, see the earlier section "Real Estate Tax Computations").
The tax data was obtained from the Department of Finance.
The tax component is based entirely on real estate taxes. The
change in taxes is estimated by comparing aggregate taxes levied
on rent stabilized apartment houses in FY 1995 and FY 1996 (For
additional detail on how the tax computation compares to last
year, see the earlier section "Real Estate Tax Computations").
The tax data was obtained from the Department of Finance.
Real estate taxes were up modestly this year, rising 3.0%. The change in taxes was largely due to a 2.5% increase in the tax rate. Expiring tax abatements and exemptions also played a role, accounting for the remaining half percent increase.
The increase in the tax rate for Class Two properties is a result of a State law which requires the tax levy to be distributed on the basis of class shares. More specifically, a large decline in the value of commercial properties compared to residential properties has shifted some of the tax burden from Class Four to other property classes, including Class Two.
Intervention by the Mayor and the City Council has softened the blow to rent stabilized properties somewhat. In FY 1995 the tax levy for Class Two properties was scheduled to increase 4.8% but action by the City Council limited the increase to 2.6%. In the current fiscal year the tax rate would have risen 5.6% had the City Council not intervened and limited the increase for Class Two properties to 2.4%.[1]
Billable assessments were fairly stable this year, falling a mere two-tenths of a percent. While valuations continued to decline in the outer boroughs (ranging from a decrease of .8% in the Bronx and Queens to 4.1% in Staten Island), the Manhattan "core" market showed some improvement, as assessments nudged ahead .6%.
The overall decline in billable assessments in the outer boroughs masks a substantial disparity between small and large buildings. While valuations for the smallest buildings (less than 10 units) rose 3.2%, billable assessments for the largest buildings (100 units or more) declined by 2.6%. In Brooklyn, the borough with the largest number of small rent stabilized buildings, assessments rose 3.8% for the smallest buildings and fell 6.0% for the largest buildings.
The increase in assessments for small buildings is due in part to the lack of a "phase- in" of real estate taxes. While increased assessments for buildings with eleven or more units are subject to a five year phase-in, such is not the case for smaller buildings. Thus, if income and property values increase among small buildings, property tax increases can be immediate.
The 1995 Income and Expense Study showed that rents rose 3.6% in small buildings while expenses increased only 1.2%, thereby resulting in NOI growth of roughly 7%. Thus, assessment increases in small buildings appear to be based in part on real improvements in profitability.
Expiring tax exemptions had an even larger effect. In Manhattan below 96th street expiring exemptions added .6% to the overall tax increase. While the impact was less in the outer boroughs, the citywide increase in taxes due to net expiration of exemptions was .5%. Given the lack of new investment in rental housing in recent years we expect expiring exemptions to continue to add to landlords' tax burden in the near future.
Of the 32,000+ rent stabilized buildings used in our tax calculations, approximately one-third (11,000) appealed their tax assessments by filing a Tax Commission Income and Expense form (TCIE). While nearly half of the stabilized properties in Manhattan filed, only one-fourth of Brooklyn owners did so.
Building size was an important consideration. Only one-fourth of small buildings (less than 19 units) filed while two-thirds of large buildings (100+ units) protested their preliminary tax levy. Within each building size category, filers tended to have substantially higher tax bills than those which did not file. For instance, in the "small building" category, the average tax bill was $7000 for buildings which did not file and $21,000 for buildings which did file. The difference reflects both location and the presence of commercial income.
Did filing with the Tax Commission make a difference? The evidence is unclear on this point. While small buildings which filed had smaller increases in taxes on average than those which did not (2.4% vs. 4.1% respectively), the opposite was true for large buildings (4.0% vs. 1.2%). For medium sized buildings, which contain the majority of stabilized units, there was no difference in the increase for filers and non-filers.
 As predicted in last year's PIOC projection, increases in labor
costs have continued to moderate, making this year's overall
change of 3.1% the lowest since 1976. The RGB measures increases
in the cost of labor by evaluating union and non-union salaries
and benefits in addition to changes in social security and
unemployment insurance. The cost of unionized labor comprises two-
thirds of the Labor component and 10% of the entire price index.
As predicted in last year's PIOC projection, increases in labor
costs have continued to moderate, making this year's overall
change of 3.1% the lowest since 1976. The RGB measures increases
in the cost of labor by evaluating union and non-union salaries
and benefits in addition to changes in social security and
unemployment insurance. The cost of unionized labor comprises two-
thirds of the Labor component and 10% of the entire price index.
The rate of increase in the labor component started declining in the mid-eighties and this year's growth rate is half that measured ten years ago. This notably low increase reflects a slowdown in benefit growth after a period of striking increases in the early 90's. The slowdown in benefit increases and a more stable, albeit moderate, growth rate for wages reflects union contract agreements signed in 1994 that run through April 1997 for Local 32B-32J and March 1998 for Local 32E. Future wage and benefit increases written into these contracts suggest that the 1997 labor component of the price index will also be quite low.
 The utilities component consists primarily of electricity,
natural gas, and water & sewer charges. Telephone and steam costs
are a small part of the utilities index. In the case of most
utility components, changes in price are measured using the PIOC
specifications (i.e. the quantity of electricity, steam etc.
being purchased) and the changes in rate schedules. Water/Sewer
costs are based on actual billings from the City's Department of
Finance and Department of Environmental Protection (DEP).
The utilities component consists primarily of electricity,
natural gas, and water & sewer charges. Telephone and steam costs
are a small part of the utilities index. In the case of most
utility components, changes in price are measured using the PIOC
specifications (i.e. the quantity of electricity, steam etc.
being purchased) and the changes in rate schedules. Water/Sewer
costs are based on actual billings from the City's Department of
Finance and Department of Environmental Protection (DEP).
This year, utilities increased 7.8% - a dramatic change from last year's decrease of 4.0%. All expenses rose, except for telephone costs, making this year's increase the highest since 1993.
In previous years Speedwell Inc. obtained water/sewer billing information on 30,000+ properties from the Department of Finance's Open Balance Register. Although the water system was operated by DEP, Finance was responsible for billing customers. Last year this responsibility was assumed by DEP, rendering instantly obsolete all of Speedwell's PIOC computer programs for calculating the change in water/sewer costs.
In a sense, the decision by the RGB to bring the water/sewer component "in house" this year was propitious, since all of the computer programs had to be redesigned in any case. RGB staff worked with DEP over a six month period to define an "extract" from the DEP billing records. By late March data on frontage and metered bills had been obtained for roughly 32,000 rent stabilized properties.
Since we were able to "download" the water/sewer data to a personal computer, it was relatively easy to examine individual records and to "clean" the data. While the frontage bills appeared to be quite accurate (although some were "lost" in the transfer of data from Finance to DEP), many of the metered bills varied enormously from year to year. To offer an example, one property supposedly had daily consumption of 31,000 cubic feet of water in 1995 and only 200 in 1996!
An effort was made to eliminate suspect metered bills or to correct those bills where adequate information was available. Unfortunately, after working extensively with the data RGB staff concluded that the information from the DEP files for properties with metered bills was unreliable, and that no amount of remedial work would make it acceptable.
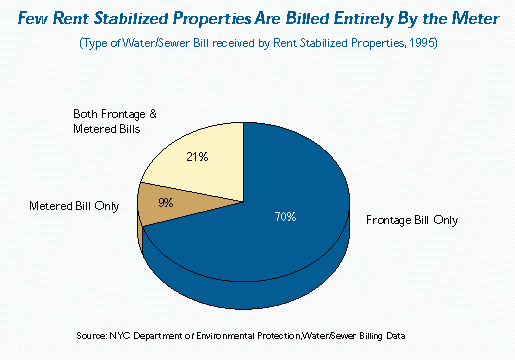
The increase in water/sewer costs from 1995 to 1996 in this price index is thus based ENTIRELY on frontage bills for 22,000 rent stabilized properties. While it is unfortunate that we could not use data for metered properties, it should be noted that 1) 70% of rent stabilized properties have "frontage only" bills, and therefore the "typical" rent stabilized property has no metered bill; 2) It is better to use reliable data than unreliable data in computing the increase in costs, even if some properties are excluded, and 3) The RGB staff will work with DEP to obtain more reliable data for the 1997 PIOC. [see chart]
The increase in water/sewer costs this year was 4.7%, roughly in line with the 5% rate increase. About 86% of the properties had increases of 5%. Approximately 10% had less than 5% increases in their bills while 4% had increases of more than 5%.
Natural gas costs rose sharply this year. The PIOC measures gas, like fuel oil, largely on a "cost-weighted" basis which takes both the price and heating degree days into consideration. Due to fluctuating rates and the unusually snowy and cold winter as well as changes in the fuel adjustment factor, gas costs rose 20%. This double-digit rise contributed greatly to the overall increase in the utilities component.
Unlike the large increase in gas, electricity had a modest rise of about 3.7%. This small increase is partly due to the traditional method of measuring the electricity index from April- to-April rather than on a cost-weighted basis. The increase would have been much higher if the electricity index was measured February-to-February (9.5%). Since electricity is generated not only by fuel oil but by nuclear and hydro power, electric rates were not as affected by this year's volatile fuel oil market.
 Greater demand in the winter months coupled with refiners' search
for oil in the early Spring led to skyrocketing prices resulting
in this year's 29.6% increase in the fuel oil component. The fuel
oil component measures changes in the price of three types of
fuel oil - #2, #4, and #6.
Greater demand in the winter months coupled with refiners' search
for oil in the early Spring led to skyrocketing prices resulting
in this year's 29.6% increase in the fuel oil component. The fuel
oil component measures changes in the price of three types of
fuel oil - #2, #4, and #6.
To calculate changes in fuel oil costs staff gathers monthly price data from fuel oil vendors and weights the data using a degree day formula to account for changes in the weather. The number of degree days is a measure of heating requirements.
Oil prices reached a five year high during the month of March due to a combination of market forces. Cold weather from November through February increased demand for oil both here and in Western Europe. The large increase in heating requirements (especially during the months of December, January, and March) compared to last year helped drive prices up.
During these months of cold weather, refiners chose to maintain low reserves in anticipation of the reopening of the Iraqi oil market. Iraqi crude would have added 700,000 barrels a day to the Spring supply. Fearing oversupply during the Spring months, refiners waited for the results of the UN talks with Iraq. When negotiations stalled in the third week of March refiners were forced to scramble for oil thus driving up the price for consumers in the month of April.[2]
Of the three grades of fuel oil, #2 saw the least change (23%) while #4 went up 30%, and #6 increased 33%. The PIOC includes a different weight for each of the fuel grades which reflects the percentage of rent stabilized units using the particular type of fuel oil. In the current year's PIOC, #6 oil accounts for half of the fuel oil component while #4 oil accounts for 27% and #2 oil 22%.
Why did prices for #6 oil increase so much more than prices for #2 fuel oil? Competition to service the many small apartment owners who use #2 fuel oil apparently forced suppliers to absorb a portion of their increase in costs in order to hold onto customers. However, only a few firms sell the #4 and #6 grades. This lack of competition allowed suppliers to pass on the full cost to large building owners who primarily use these less refined types of fuel.
 Contractor Services increased 1.8% in 1996, the second lowest
rate of growth in eleven years. Sixteen items comprise this
component of which repainting and plumbing costs are by far the
most important.
Contractor Services increased 1.8% in 1996, the second lowest
rate of growth in eleven years. Sixteen items comprise this
component of which repainting and plumbing costs are by far the
most important.
In 1994, we suggested that the record low increase of .9% was primarily due to painters slashing prices in an effort to hold onto customers. Last year more painters raised prices but the Contractor Services growth rate was still only 2.4%. This year's small increase in costs was affected considerably by a .2% decrease in painter's fees and, to a much lesser extent, larger decreases in floor maintenance costs. While many painters surveyed this year noted that the price of paint and labor had increased, most maintained or lowered their prices in order to stay competitive.
Boiler and roof repair went up considerably this year - 4.0% and 4.6% respectively. This winter's heavy snowfall put pressure on both heating systems and roofs driving up demand for the services of plumbers and roofers, and consequently prices. The moderate increases in the remaining items in Contractor Services (elevator, range and air conditioning repair) helped dampen the effects of boiler, roof and plumbing repair in the final calculation of the Contractor Services component of the index.
 Administrative Costs rose 3.5%, which is slightly higher than the
average of the past five years. Fees paid to management
companies, accountants, and attorneys comprise the bulk of this
component. Accountants had the highest increase (3.9%).
Management companies, which tend to base their fees on rental
occupancy, had an increase of 3.6%. Attorney fees rose only 0.9%
- much less than last year's figure of 4.5%.
Administrative Costs rose 3.5%, which is slightly higher than the
average of the past five years. Fees paid to management
companies, accountants, and attorneys comprise the bulk of this
component. Accountants had the highest increase (3.9%).
Management companies, which tend to base their fees on rental
occupancy, had an increase of 3.6%. Attorney fees rose only 0.9%
- much less than last year's figure of 4.5%.
During the last five years, administrators have had higher increases than their counterparts, skilled contractors. The trend continues this year - Contractor Services increased only 1.8%. Part of the difference between the two components is undoubtedly due to the relatively strong rental market and the resulting increase in Management Fees, which is about half of the Administrative Costs component. Demand for Contractor Services, on the other hand, is linked to a greater degree to overall economic conditions which remain relatively anemic.
 Insurance Costs rose 5.0% this year, down slightly from last
year's increase of 5.2%. The increase in costs was due in large
part to higher insurance rates. Of the 430 owners who responded
to our survey 152 (35%) reported an increase in rates while only
one fourth as many (9%) reported a decrease.
Insurance Costs rose 5.0% this year, down slightly from last
year's increase of 5.2%. The increase in costs was due in large
part to higher insurance rates. Of the 430 owners who responded
to our survey 152 (35%) reported an increase in rates while only
one fourth as many (9%) reported a decrease.
Changes in insurance coverage also contributed to the substantial rise in insurance costs. Over a quarter of the respondents indicated some sort of change in their insurance policy. Increased insured value was the main form of coverage affected. In 95% of the policies where the insured value of the building was increased the cost of insurance went up.
In recent years, the lead paint issue has come to the forefront of building owner concerns. Not only are owners removing lead paint from their buildings at an increased rate but insurance companies are rethinking their commitment to insure for lead paint liability. Many companies have removed lead paint coverage altogether making it more difficult and more costly for owners to obtain this type of coverage.
The Owner Survey found that 26 respondents no longer were covered for lead paint liability while only 3 added lead paint coverage. Of those who dropped their lead paint coverage only half benefitted from lower insurance costs. The very small group of owners who added lead paint coverage saw their insurance costs rise an average of 26%.

The overall increase in the Parts and Supplies component was less than 1%. Increases in this component have been fairly consistent and generally very low since the early '80's. This year is no exception. Price increases ranged from a high of 4.8% (new electrical switch plate) to a decrease of .4% (bucket).

The Replacement Costs item is even less significant than the Parts and Supplies Component, its weight being less only 1/100th of the PIOC. This year's increase in the Replacement Costs component was only 1%.
The price index for all hotels rose 5.2% this year, somewhat less than the increase in the apartment price index. The primary differences between the hotel index and the apartment index were in the taxes and utilities components. Taxes rose only 1.6% overall (vs. 3.0% in apartments) due to a slight decrease in taxes for large hotels. Utilities were up only 6.1% (vs. 7.8% in the apartment sector) because hotels spend less of their budget on gas and more on electricity. Electricity costs were only up 2 to 4%.
Among the different categories of hotels, the increases were: Hotels 3.9%, Rooming Houses 6.5%, and SROs 6.5%. The smaller rate of increase for the "Hotels" category was largely due to a slight decrease in taxes for these buildings (vs. increases of 5.5% and 1.9% for Rooming Houses and SROs respectively). In addition, labor (which rose modestly) is a large portion of the cost of running large Hotels.
     Change In Costs for Rent Stabilized
     Hotel Buildings, April 1995 to
     April, 1996

     Taxes                     1.6%
     Labor Costs               3.7%
     Utilities Costs           6.1%
     Fuel Costs               25.7%
     Contractor Services       1.1%
     Administrative Costs      4.2%
     Insurance Costs           5.0%
     Parts & Supplies          0.3%
     Replacement Costs         2.8%

     Overall                   5.2%
     Change In Costs for Rent Stabilized
     Loft Buildings, April 1995 to
     April, 1996

     Taxes                          3.0%
     Labor Costs                    3.3%
     Utilities Costs                7.8%
     Fuel Costs                    27.6%
     Contractor Services            1.8%
     Administrative Costs, Legal    0.9%
     Administrative Costs, Other    3.9%
     Insurance Costs                5.0%
     Parts & Supplies               0.8%
     Replacement Costs              1.0%

     Overall                        4.8%
The volatility of fuel oil prices, and their destabilizing effects on electricity and gas costs, has hampered the accuracy of PIOC projections over the past several years. Fuel-related costs (heating fuel, electricity and gas) compose roughly one- sixth of the market basket of operating costs measured by the PIOC. Large changes in fuel prices can mask smaller changes in non-fuel-related costs resulting from local trends, such as declining unemployment or growth in the gross city product. While property owners and tenants are affected by forces operating within and outside of New York, the drastic and somewhat cyclical nature of fuel price changes in recent years seems to obscure the deeper long term movement of the PIOC.
To gauge long term movements in prices, RGB staff has estimated changes in both the regular PIOC and a "core" PIOC for 1997. Projection of the "core" PIOC holds fuel-related cost components constant while estimating growth in non-fuel related operating costs. Overall, the PIOC is expected to grow by 2.7% between 1996 and 1997, while the "core" PIOC is expected to increase by 3% over the same period. Projected changes in the index's separate components are shown alongside actual increases observed from 1995 to 1996 in the chart.
The distribution of New York City's tax burden among various types of property in the city usually changes from year to year. Since 1990, Class Two properties (which include rent stabilized buildings) have assumed a greater share of the city's tax levy, mainly because of sharp drops in the value of office and retail properties. Although commercial real estate is regaining value, particularly in Manhattan, Class Two properties are expected to shoulder a greater share of the city's tax levy in the near future. Barring action from the Mayor and City Council, this should result in an increase in the tax rate for Class Two buildings next year.
Class Two property includes co-ops and condominiums as well as apartments. Within the Class Two category, rent stabilized dwellings are classified as either "rental buildings" or "4-10 family buildings". Based on the preliminary tax roll, the Finance Department forecasts billable assessments for rental buildings to increase by only 0.1%, while billables for 4-10 family buildings are expected to increase by 2.1%. Overall, billable assessments for stabilized buildings, which are predominantly classified as "rental" buildings, would increase by 0.4% from 1996 to 1997.
In the past, the Finance Department's preliminary tax roll, which is an estimate, has tended to be higher than the final tax roll, upon which taxes are actually calculated. Accurate tax projections must adjust for this "gap", which amounted to .5% for stabilized properties in 1996. Assuming that the discrepancy between the preliminary and final tax roll is also .5% in FY '96, billables should decline by .1%. This slight decline in billables, combined with a projected 3.7% tax rate increase should result in a 3.7% increase in tax bills for rent stabilized buildings.
Growth in wages and benefits this past year was the lowest observed since 1985. Next year, growth in non-union wages and benefits should drive "Labor Costs" up by 4%. This projection relies on the most recent multi-year contract agreements negotiated between building owners and unions representing building workers and, in the case of non-union employees, average increases in wages and benefits observed over the past three years.
Similarly projected increases in "Administrative Costs" (3.7%) and the price of "Contractor Services" (1.7%) were derived from average growth rates witnessed in both components during the past three years.
The Energy Information Administration (EIA) currently projects that world oil prices will hover around $16 per barrel between the fourth quarter of 1995 and the fourth quarter of 1996. The first assumption behind this forecast is that non-OPEC producers will continue to increase their efficiency, and that OPEC countries will cut prices to retain market share. The second major assumption holds that national demand for oil will not increase rapidly, as rising interest rates and inflation dampen economic growth in the upcoming year. As usual, winter weather for the mid-Atlantic region is assumed to be "normal".
Overall, using EIA forecasts of increasing global production and stable national demand (and assuming fairly "normal" weather conditions), fuel oil prices in the New York area should decline by 6.1% in 1997.
Next year the overall price of utilities should increase by 4.7%. The bulk of this growth will come from rising water and sewer rates (6.5%), combined with more moderate increases in the costs of natural gas (5.6%) and electricity (0.1%).
The New York State Public Service Commission (PSC) estimates that electricity rates, which dropped slightly in April, will remain stable through 1997. Additionally, the PSC predicts that stagnant oil prices should keep fuel adjustment charges from increasing sharply over the year. Thus, the price of electricity should remain stable over the coming year if climate patterns follow normal trends and the price of fuel behaves as predicted.
In contrast to electricity, rates for natural gas should rise over the coming year. Both Con Ed and Brooklyn Union Gas plan to petition the Public Service Commission for increases in gas rates in October, as record demand for natural gas across the nation propels the price upwards. Overall, rising nationwide gas demand and Con Ed's request should boost overall gas rates in New York City by roughly 5.5% over the next year.
During the past ten years, water and sewer rates have grown the fastest of all the components of the Utility Cost category. After consecutive double digit increases, water and sewer rates were frozen by Mayor Dinkins from 1993 to 1995. Last year, rates were unfrozen, and rose by 4.7%. Assuming the current proposals for rate increases are approved by the Water Board, water/sewer rates will probably increase by about 6.5% in 1997.
In total, a 6.5% increase in water and sewer charges, combined with 5.5% growth in natural gas prices and relatively stable electricity rates, should cause Utility Costs to rise by 4.7% in 1997.
     One Year Lease     Two Year Lease
           4%                 5%
As a means of compensating landlords for cost increases, the commensurate rent increase formula has two major drawbacks. First, although the formula is supposed to keep landlords' current dollar income at a fixed level, the formula doesn't consider the mix of one and two year lease renewals. Since only two-thirds of leases are renewed in any given year, and a preponderance of leases are for two years, the formula does not necessarily accurately estimate the amount of income needed to compensate landlords for past O&M increases.
A second possible flaw of the commensurate formula is that it does not consider the erosion of landlords' income by inflation. By maintaining current dollar net operating income at a constant level, adherence to the formula may cause profitability to decline over time, although this is not an inevitable consequence of using the commensurate.[4]
An alternative to the commensurate rent increase adjusts for the mix of lease terms and sources of landlord revenue allowed by the RGB other than lease renewals (e.g. vacancy renewals). This is called the "Net Revenue" rent increase, and takes into consideration the mix of leases actually signed by tenants but does NOT adjust NOI for inflation. Two guidelines which would preserve "Net Revenue" in the face of this year's 6.0% increase in PIOC measured costs are:[5]
Computation of "Net Revenue" Increases

              1 Year     2 Year        Vacancy        Low Rent
               Lease      Lease      Allowance      Supplement

Option One       5%         7%            -               -
(Lease renewals only)

Option Two       3%         4%           8.5%           $20
(Lease renewals, vacancy allowance and low-rent supplement)
An alternative to this "Net Revenue" formula would be to consider lease terms and to adjust NOI upward to reflect inflation so that BOTH O&M and NOI remain constant. We will call this the "Net Revenue with Adjusted NOI" increase. Assuming that revenue from an across-the-board vacancy allowance and a $20 surcharge (for units renting below $400) is included in these calculations, a variety of guidelines would preserve "Net Revenue" in the face of 3.5% growth in the Consumer Price Index alongside a 6.0% rise in the PIOC[6]:
Computation of "NOI Adjusted Net Revenue" Increases

              1 Year     2 Year        Vacancy        Low Rent
               Lease      Lease      Allowance      Supplement

Option One       7%         8%            -               -
(Lease renewals only)

Option Two     4.5%         6%           8.5%           $20
(Lease renewals, vacancy allowance and low-rent supplement)
All of these methods have their limitations. The traditional commensurate increase is artificial and doesn't consider the impact of lease terms or inflation on landlords' income. The "Net Revenue" formula does not attempt to adjust NOI based on changes in interest rates or deflation of landlord profits. The "Adjusted NOI" formula inflates the debt service portion of NOI, even though interest rates have been falling, rather than rising over recent years.
Each of these formulas may be best thought of as a starting point for deliberations. The staff's other research (e.g. the mortgage survey or the I&E study) and testimony to the board can be used to modify the various estimates depending on these other considerations.
2. The New York Times, Thursday, March 21, 1996, "Run-up in Oil Price Halts; April Contract Falls $1.28"
3. The accuracy of the PIOC is assumed as is the collectibility of legally authorized increases. Calculating the "traditional" Commensurate Rent Increase requires an assumption about next year's PIOC. In this case we use 2.7%, staff's PIOC projection for 1997.
4. Whether profits will actually decline depends on the level of inflation, the composition of net operating income (i.e. how much is debt service and how much is profit), changes in tax laws, and interest rates.
5. The following assumptions were used in the computations: (1) The required increase in landlord revenue is 4%, or 67.6% of the 1996 PIOC increase of 5.95%; (2) These lease terms are only illustrative. Other combinations of one and two year lease increases could also result in a 4% revenue increase. (3) Lease terms were derived from the 1993 NYC Housing and Vacancy Survey. According to the HVS, 29% of all tenants have a one-year lease and 72% have two-year leases half of which renew in a given year. As a result, 65% of tenants renew their leases in a given year. The increase in landlords' revenue reflects this lease distribution. (4) The 1993 HVS showed a turnover rate of 12.3%. As a result of turnover, landlords can expect an increase in revenue of about one percent, given the 8.5% vacancy allowance. This assumes that the vacancy allowance is charged and is collectible in all cases.
6. Note: The NOI was adjusted upward by the most recent yearly increase in the Consumer Price Index, March 1995 to March 1996, which amounted to 3.5%.