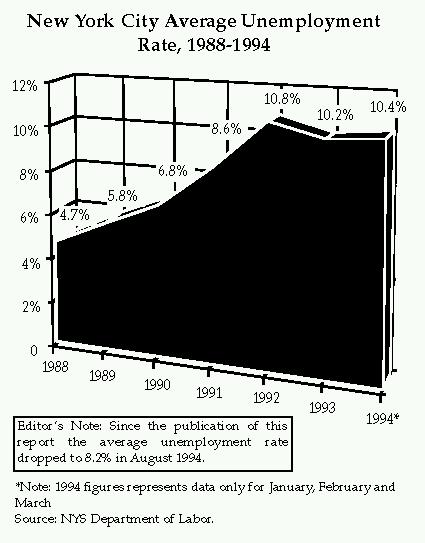
Employment in New York has continually declined since the late 1980's, when the onset of a deep national recession combined with the stock market crash of 1987 stalled the city's economic growth. Joblessness in the city soared from 4.7% in 1988 to 10.8% in 1992, as hundreds of large and small firms reduced their payrolls to remain solvent.
Recent surges in output and job creation during the latter half of 1993, which reduced national unemployment to a three year low (6.4%), have spurred some hope for renewed job growth in New York. Although unemployment in New York fell by sixth-tenths of a percent (from 10.8% to 10.2%) in 1993, this reflected a decrease in the city's labor force from 56.3% to 55.4% of the work aged population rather than substantial new job growth.(1) Data from the State Department of Labor indicates that the city's unemployment rate rose to 10.4% during the first quarter of 1994, due to contraction in the construction, manufacturing and wholesale sectors.
See chart New York City Average Unemployment Rate, 1988-1994
While employment in New York's economy has stagnated in recent years, productivity has risen. The Office of the Deputy Mayor for Finance and Economic Development estimates that the city's real (inflation adjusted) gross city product grew by 4.1% in 1992, the largest increase witnessed since 1986. Financial and corporate service firms have experienced the greatest productivity gains by using advanced technology to generate increased revenues and profits with a smaller, more efficient work force comprised of more skilled, highly paid managers and fewer lower skilled clerical and support staff.(2) Many economists expect the trend towards fewer employees generating larger sales and profits to continue well into the next decade. Because New York's financial and service sectors pay disproportionately well (in 1991, the securities industry alone employed 4% of New York's total work force, yet paid 10% of the total wages earned by city residents) overall gains in employment are unlikely until hiring in these key sectors starts to rise.
Nonagricultural employment in New York continued to drop during 1993, but at a lower rate than experienced either in 1991 or 1992. As the chart Average Annual Change in NYC Payroll Employment by Industry, 1990-1993 shows, while New York lost 10,000 total jobs over the past year, the city's construction, manufacturing, transportation and financial sectors experienced much less job erosion than in previous years. Growth in service sector employment (26,000 positions) buoyed total private employment, causing a net decline of only 2600 jobs in the private sector. On the other hand, New York's public sector continued to contract, eliminating 7600 jobs in 1993 due to fiscal retrenchment within both the state and municipal governments. While this data may signify New York's emergence from its long recession, preliminary employment figures for the first three months of 1994 cast doubt on this assumption. This information indicates large job cutbacks in the city's construction, manufacturing and wholesale sectors which, combined with little growth in service employment, has produced a net loss of jobs. How much of this current decline is attributable to seasonal factors cannot be determined.
In the past, without the availability of up-to-date information from New York's Housing and Vacancy Survey (HVS), staff was forced to use less targeted data to gauge shifting income patterns among rent stabilized tenants. This year we were able to compare the findings of past HVS data with the current 1993 HVS.
In 1992, the average real (inflation adjusted) income for all stabilized tenants was $26,819. This represented a substantial decrease of 10.3% from the 1990 real average of $29,896.(3)
For non-Netscape table, click here or see end of current page.
| Income Quartile | 1990 - 1992 |
|---|---|
| First (Poorest) | - 8.5% |
| Second | - 12.3% |
| Third | - 10.1% |
| Fourth (Wealthiest) | - 4.8% |
Source: 1991 and 1993 HVS
Erosion of income was not shared equally among rent stabilized tenants. Grouping stabilized households into four income categories (quartiles), as shown in the above table ("Change in Real Average Income, Rent Stabilized Households, 1990-1992"), illustrates this disparity. This pattern may reflect heavy job losses among New York's "pink" and "white" collar work force, as well as on-going employment decline in the city's manufacturing industries between 1990 and 1992.
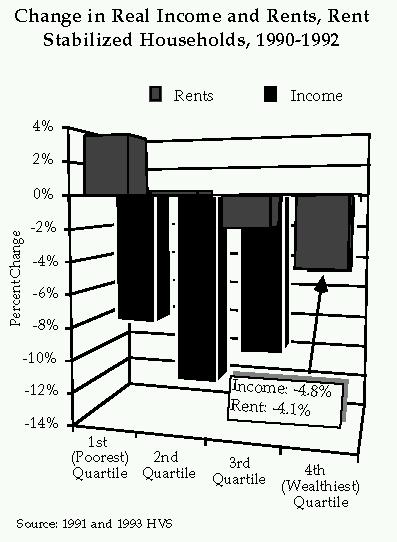
While household income has recently declined in rent stabilized households, rents have risen. According to data from the 1991 and 1993 HVS, the mean average contract rent in stabilized units grew by 7% between 1991 and 1993. These increases have primarily affected lower income households, as the chart Change in Real Income and Rents, Rent Stabilized Households, 1990-1992 shows.
Declining incomes and increasing rents have forced the median contract rent-to-income ratio for stabilized units to grow significantly, from 26% in 1991 to 28% in 1993. Lower income stabilized households appear to have suffered most from this increasing rent burden, as the rent and income data in the chart illustrates. Although their income did not erode as quickly as that of more affluent households, the poorest stabilized households suffered the most between 1990 and 1992 because they faced the highest rent increases with the least amount of "disposable" income on hand to divert from non-essential items to housing costs.
Among the worst dilemmas facing New York is that the number of low paying, unskilled jobs in the city is shrinking faster than the creation of highly paid, skilled managerial positions in the financial and service sectors.(4) Given this situation, it is logical to assume that low-income households are disproportionately affected by declines in employment and income.
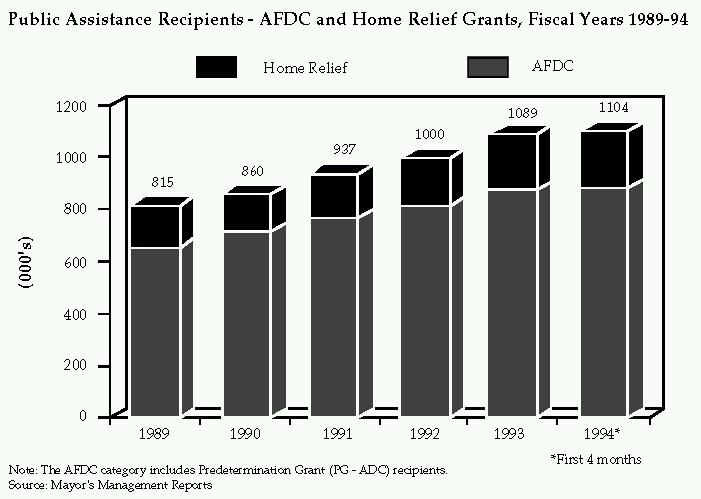
In late 1992, public assistance recipients in New York numbered over 1,000,000. One year later, the number of people receiving public assistance grew by 8.9%, as shown in the chart Public Assistance Recipients -- AFDC and Home Relief Grants, Fiscal Years 1989-994. Estimates for the first four months of 1994 indicate an additional 1.4% increase from the 1993 total. While part of this increase can be traced to larger numbers of individuals with AIDS-related illnesses, the bulk of this case load stems from economic conditions.
Approximately 5700 families were housed in temporary city shelters by the end of 1993, an increase of 8.9% since the end of 1992. Over the first four months of 1994, this figure has fallen to 5560 families, which is still greater than the number temporarily housed at the start of 1993.
According to documentation in the Mayor's Management Report, New York is combating homelessness in many ways. Through the Emergency Assistance Rehousing Program, the city has continued its efforts to relocate families from the shelter system to permanent housing. During the first four months of the 1994 Fiscal Year, the Human Resources Administration (HRA) successfully relocated over 1,599 families to permanent housing, a 6% increase compared to the same period in Fiscal 1993. The city also plans to increase its voucher program for homeless families who agree to participate in the New York City Housing Authority's Family Self-Sufficiency Program.
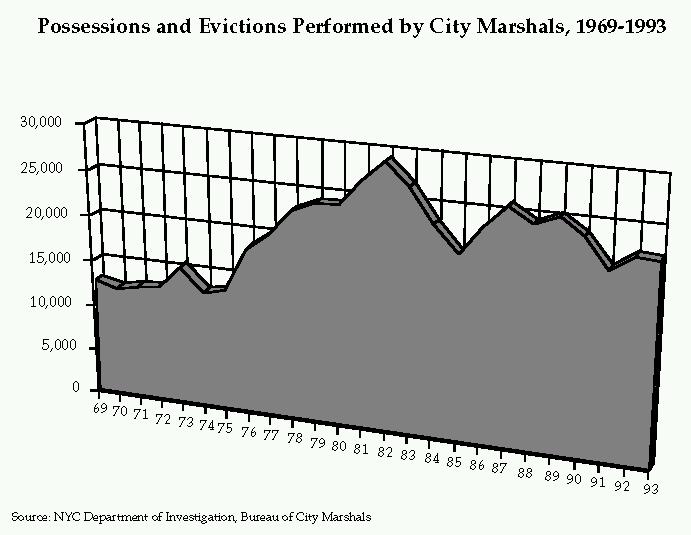
Long term trends in housing court actions and evictions reflect, for the most part, economic and institutional forces. Court proceedings are costly and time consuming. In a loosening housing market where the benefit of a vacancy is declining, the incentive for owners to work out resolutions with late paying tenants is heightened. At the same time, new housing opportunities for those who can afford them may reduce the number of tenants forced to hang on until an eviction is secured. Whatever the explanation, the effect of this recession on non-payment and eviction proceedings has not paralleled the sharp rise witnessed during the last recession of the 1970's and early 1980's.
As shown in the chart Non-Payment Petition Filings and Case Intakes in NYC Housing Courts, 1983-1993, non-payment petitions have remained flat for several years, rising slightly to 295,000 in 1993 from 289,000 in 1992. Case intakes, reflecting non-payment actions noticed for trial (less restorations), have risen for the past six years, from a low of 77,000 in 1987 to 124,000 in 1993. In general, it seems that fewer tenants are able to resolve non-payment actions prior to court appearances. Despite this, as the chart Possessions and Evictions Performed by City Marshalls, 1969-1993 shows, the number of evictions fell to 21,900 in 1993, a slight (.5%) decrease from the 22,000 carried out in 1992.
   Change in Real Average Income,
Rent Stabilized Households, 1990-1992

Income Quartile         1990 - 1992
---------------         -----------
First (Poorest)            - 8.5%
Second                    - 12.3%
Third                     - 10.1%
Fourth (Wealthiest)        - 4.8%

Source: 1991 and 1993 HVS
To return, click here