Despite on-going complaints from both tenant and landlord groups, little reliable information existed for gauging the accuracy of the PIOC until 1990. In that year, RGB staff gained access to a new source of data which permitted independent verification of the PIOC's accuracy: income and expense (I&E) statements, collected annually by the Department of Finance from owners of "income producing" properties. These I&E statements contain detailed information on income and costs in rent stabilized buildings, and are particularly useful because they comprise both cross-sectional data, reflecting the condition of various types of rent stabilized buildings in a given year, and longitudinal data, which reflect changes in the condition of buildings which have filed I&E forms in at least two successive years.
Over the last five years Finance has provided the RGB with summary data for a random sample of rent stabilized properties. Samples in the first two studies were limited to 500 buildings, because RPIE files were not automated. Two years ago, following the computerization of all I&E filings, the sample size was increased to over 10,000 properties.
The data used in this report was primarily summarized from 1993 RPIE forms returned to the Department of Finance by building owners. Longitudinal data encompasses properties which filed RPIE forms in both 1992 and 1993. However, analysis of filing dates indicates that RPIE averages reflect conditions occurring around July of the calendar year in question, so that this year's longitudinal study measures changes in costs and income from July 1991 to July 1992.
This year 12,836 and 9910 buildings were respectively analyzed for the cross-sectional and longitudinal I&E studies. Figures were produced by matching a list of 39,000 rent stabilized properties registered with the New York State Division of Housing and Community Renewal (DHCR) with a list of buildings which had filed a 1993 RPIE statement (or both a 1992 and 1993 statement in the longitudinal sample). Buildings on the RGB list were excluded from both samples for the following reasons:
Traditionally, average rents culled from RPIE filings tend to be lower than data on mean contract rents found in the triennial New York City Housing and Vacancy Survey (HVS). This disparity mainly stems from the fact that the I&E data accounts for vacancy and collection losses, in addition to reflecting rents collected over a 12-month period (the HVS is usually conducted in the first three months of any given year).
Using data from the 1991 and 1993 HVS, the mean contract rent for all rent regulated apartments in 1992 ($559) exceeded the average rent from the 1993 RPIE data by roughly 7%.(1) The mean contract rent in older pre-war apartments ($514) stood about 10% higher than the 1993 RPIE average, while the 1992 mean contract rent for units built after 1946 ($670) exceeded the 1993 RPIE average for such dwellings by 1%.
Similar gaps between HVS and RPIE data were observed in last year's I&E study, particularly for the pre-war sector, where mean contract rents exceeded average rent collections by 13.5%. If even a portion of these observed "gaps" between HVS and RPIE data reflect vacancy and collection losses, then it seems that older rent stabilized buildings face much greater hardships than modern properties in the actual collection of their annual income.
It is also interesting to note the relationship between rent levels registered with the New York State Department of Housing and Community Renewal (DHCR) and rent collections reported by landlords in the I&E filings. The gap between legal rents and rents actually collected may reflect a number of factors, including preferential rents, rents in controlled units, collection losses, and vacancy losses. Between 1988-1991, staff estimated that collected rents dropped from about 90% to 85% of registered rents. Between 1991 and 1992 this gap closed slightly, as collections increased to 86% of registered rents.
The disparity between collections and registered rents varied widely among the boroughs, with properties in Manhattan collecting only 83% of the registered average, while buildings in the Bronx collected 89%. The respective collection rates in Brooklyn and Queens stood at 87% and 88%.
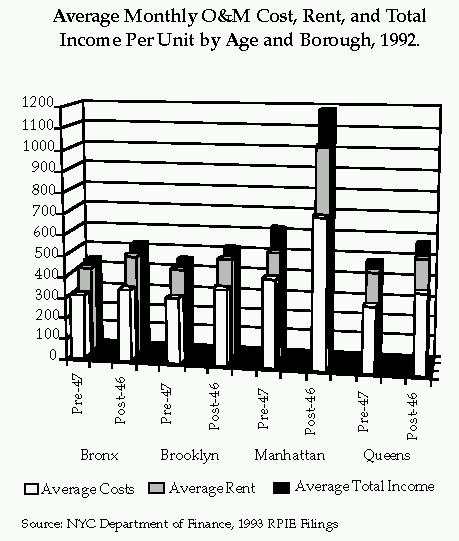
Use of a sample exceeding 500,000 units allows reliable statistics to be calculated for rent in most of the building types encountered throughout New York's boroughs. The chart Average Monthly O&M Cost, Rent, and Total Income Per Unit by Age and Borough, 1992 shows average rent for each of the building types.
Many owners of rent stabilized apartment buildings augment their income by selling services to their tenants as well as renting ground floor commercial space. The 1993 RPIE filings show an average gross income of $576 per rent stabilized unit, including the sales of services (e.g. laundry, garages/parking), as well as rent from commercial units. Such proceeds constituted roughly 11% of the total income earned by building owners in 1992. Manhattan owners especially benefit from commercial income, with 16% of their income coming from commercial units and services. The respective figures for the other boroughs are 7% in Queens and 5% in both Brooklyn and the Bronx.
The average monthly operating and maintenance cost for all rent stabilized units was $395 in 1992. Costs were substantially higher for Post '46 units ($482) and much lower for the pre-war stock ($364). In the boroughs costs parallel rents - lowest in the Bronx ($320) and highest in Manhattan ($490). The chart 1992 Average Operating and Maintenance Cost by Building Size and Age shows costs according to building size and age.
Over the past five years, the Department of Finance and RGB staff have extensively scrutinized RPIE expense data for accuracy. Assessments of early samples indicated that more than half (55%) of "miscellaneous" costs were actually administrative or maintenance costs, while another 15% were not valid business expenses. Finance explored these findings further in 1992 by conducting thorough audits on the income and costs of forty-six rent stabilized properties.
The auditors ultimately found that owners overstated O&M costs in RPIE filings by about 8%. Costs tended to be less accurately recorded in small (11-19 units) and medium (20-99 units) sized buildings (overstated by 13% and 9% respectively). Expenses in large (100+ units) buildings appeared to be more accurate (overstated on average by only 2%), but remain somewhat inconclusive since several owners of large stabilized properties refused to cooperate with Finance's assessors.
Expense reductions were concentrated in three categories: maintenance, administration, and miscellaneous costs. Maintenance had to be lowered by an average of 11% for all buildings, while administration and miscellaneous costs were respectively trimmed by approximately one-quarter (25%) and one-third (37%). Adjustment of 1993 RPIE data by the results of the 1992 audits reduces the average monthly O&M cost for stabilized units from $395 to $366.
Audit-adjusted monthly O&M costs for buildings without commercial units were about $25 lower ($341) than the average for all buildings. Last year, RGB staff found that taxes accounted for 40% of the difference between "all-residential" buildings and all stabilized buildings, with one quarter of the remaining variance attributed to maintenance and labor expenses. This year taxes accounted for more than half (54%) of the difference while labor, maintenance and "miscellaneous" costs accounted for more than one quarter (29%) of the total variation. Taxes, labor and miscellaneous costs were respectively 13%, 12% and 5% lower on average for buildings without commercial space than for all stabilized properties.
RGB staff estimates that the proportion of gross income spent by stabilized building owners on audited operating costs averaged 59.6% in 1988 and 60% during 1989. In 1990, rapidly escalating expenses pushed this ratio to 62.3%. Since 1990, the cost-to-income ratio has continued to increase, although at a slower rate, rising to 62.9% between 1990 and 1991 and growing again to 63.4% from 1991 to 1992.(2)
On average, in 1992, nearly two-thirds of total expenses in stabilized buildings were comprised of property taxes, maintenance, labor, and fuel costs. Maintenance and fuel costs occupied larger shares of total expenses in older (pre-47) buildings, while taxes and labor costs were less important. On the other hand, newer (post-46) buildings spent relatively more money on taxes and labor costs and less on maintenance and fuel costs. Much less variation was observed within the other four expense categories (utilities, administrative, insurance and miscellaneous costs) among buildings of different age.
Building size also affects the distribution of costs. Taxes, labor, fuel and maintenance costs again dominate overall expenses. Labor costs are particularly associated with size, comprising a greater share of total O&M costs in larger buildings. This may be due to the concentration of large modern (post-46) stabilized buildings in Manhattan, which tend to employ doormen. In contrast fuel, maintenance and insurance decrease with size, probably due to efficiencies of scale realized by larger properties, particularly those with more than 100 units.
| All | Pre 1947 | Post 1946 | 11-19 | 20-99 | 100+ | |
|---|---|---|---|---|---|---|
| Taxes | 23% | 21% | 29% | 28% | 22% | 26% |
| Labor | 13% | 12% | 17% | 6% | 11% | 21% |
| Fuel | 11% | 13% | 8% | 13% | 13% | 6% |
| Utility | 11% | 11% | 11% | 10% | 11% | 10% |
| Maint. | 19% | 20% | 5% | 19% | 20% | 16% |
| Admin. | 11% | 11% | 10% | 11% | 11% | 10% |
| Insurance | 6% | 6% | 4% | 7% | 6% | 4% |
| Misc. | 6% | 7% | 5% | 6% | 7% | 6% |
| Total* | 100% | 100% | 100% | 100% | 100% | 100% |

In buildings where expenses exceed income, unprofitability is both a function of abnormally high expenses (114% of the all-building average in 1992) and abnormally low rents (only 68% of the all-building average in 1992). Most of the variance in unadjusted costs between these and other stabilized buildings was found in the fuel, maintenance and "miscellaneous" categories, which in these "distressed" buildings were respectively 135%, 135% and 187% of the stabilized average. Not surprisingly, these buildings also paid less property taxes (85% of the all-building average) than other stabilized structures in 1992.
1992 appears to have brought relief to some rent stabilized landlords in Manhattan. Over the past few years high vacancy rates, above average rents, and the city's weak economy had prevented many owners of post-war properties in the borough from collecting all of the rent increases authorized by the RGB. The "drought" that affected such buildings in 1991, during which rent collections actually declined, seems to have abated somewhat during 1992 with rents in Manhattan's post-war stock growing by 1.5%. Nevertheless, rent increases in this stock lagged substantially behind the marketwide average.
In contrast to the 1980's, when rent collections accelerated faster than the RGB's expectations, this year's increase of 3.5% roughly paralleled both the RGB's rent index (4%) and the increase observed in DHCR registered rents (3.8%) between 1991 and 1992.
Gross income (i.e. apartment rent, sales of services, and commercial rent) collected by owners between 1991 and 1992 increased by 3.1%, slightly less than growth in apartment rents. In keeping with previous years, income in pre-47 units rose at a greater rate (3.3%) than in the post-46 stock (2.7%). In terms of size, income grew fastest in medium-sized buildings (4.2%) and slowest in large ones (2.9%).
Among the various costs faced by building owners, taxes, utilities and labor costs grew fastest (by respectively 7.7%, 7.4% and 5.7%) from 1991 to 1992. In contrast, fuel costs remained stable (-0.1%) and insurance costs actually fell by 2.8%. Maintenance expenses made a surprising rebound, growing by 4.2% in 1992 after decreasing by 1.7% in the previous year. Whether such growth reflects greater investment in rent stabilized properties (and thus generally better conditions) or merely inflation cannot be determined with certainty.
How do the changes in the I&E figures compare with the cost increases measured by the PIOC? Differences in the methods used to measure O&M components make comparisons between the two sets of data rather inexact. For example, many of the components examined in the PIOC are measured on an April-to-April basis, while most expense statements (88%) filed by landlords are based on the calendar year. Reconciling this difference requires use of a weighted average of two PIOC years to render figures resembling I&E data. Comparison between the two sources of information is thus achieved at the cost of some distortion.
Analysis of PIOC and I&E data is further muddied by the fact that the two indices measure different things. Income and expense statements reflect actual expenditures incurred by landlords, while the PIOC heavily relies upon proxies to estimate actual shifts in O&M costs. Furthermore, the PIOC monitors the costs associated with maintaining properties to a constant standard of quality, while RPIE filings may reflect the investment or disinvestment patterns of building owners. Thus, rising O&M costs reported by RPIE filings may reflect price inflation, in which landlords are forced to spend more to maintain a given level of housing quality, or shifts in investment, where building owners change the quality of their buildings by spending more or less money to maintain them.
Despite those drawbacks, it is useful to make this comparison in order to evaluate how well the PIOC methodology tracks changes in costs. Over the past few years, growth in PIOC-measured costs has consistently outpaced expense increases reported by building owners in RPIE data. During 1990, costs in the PIOC increased 9.6% while those reported to Finance grew by 7.1%. The following year, the PIOC rose 5.5% as RPIE costs went up 3.4%. This persistent gap closed in 1992, with costs in both the PIOC and RPIE filings growing by 4.2%.
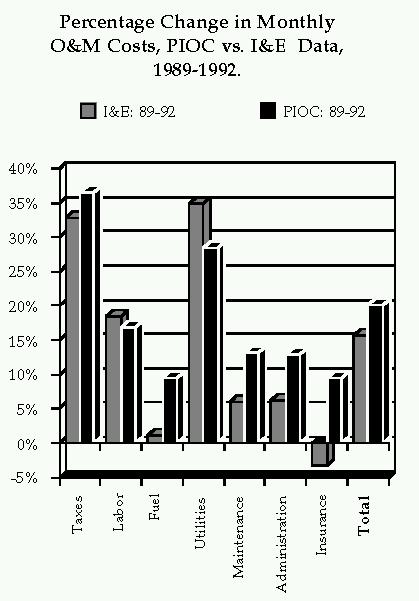
The chart Percentage Change in Monthly O&M Costs, PIOC vs. I&E Data, 1989-1992 illustrates the different growth rates reported by RPIE filings and the PIOC for various costs between 1989 and 1992. During that three year period, the price index indicated a 20% increase in total O&M costs, while actual expenditures reported to Finance rose 16%. All of this difference between the I&E filings and the PIOC occurred between 1989 and 1991, when RPIE and PIOC costs respectively increased by 11% and 16%.
Reducing overall O&M expenses into component costs reveals some similarities between PIOC and RPIE data. Between 1989 and 1992, components with both the highest and lowest growth rates in RPIE filings (taxes/utilities and fuel/insurance) respectively had the highest and lowest rates in the price index. However, as the chart ("Percentage Change in Monthly O&M Costs, PIOC vs. I&E Data, 1989-1992") shows, while the PIOC tracked actual changes in taxes and utility costs quite well over the three year period, the index may not have accurately measured shifts in fuel and insurance costs.
In the case of insurance, the difference between PIOC and RPIE figures may reflect a decrease in the level of insurance used by building owners, although the PIOC does attempt to compensate for changes in coverage. The discrepancy in fuel costs may stem from the "degree-day" formula used to compute PIOC fuel costs, which may overemphasize changes in the weather. In addition, the I&E data does not account for lags between the consumption of fuel by building owners and the time they are billed by fuel providers.
Three years is hardly enough time to accurately assess the effectiveness of the PIOC and its various components. Hopefully, future years will allow the RGB to trace the source of discrepancies between these two data sources, and to maximize the performance of the PIOC in measuring operating cost changes.
The percentage of buildings with an O&M to income ratio in excess of 100% declined from 12% to 11% of the roughly 10,000 buildings that filed RPIE forms in 1991 and 1992. Though there are slightly fewer buildings operating with an income ratio over 100%, the basic characteristics of these buildings do not differ from year to year. As reported in the cross-sectional study, these buildings have low average rents and high operating expenses. Unfortunately, the summary statistics available to staff are not adequate for a more insightful analysis. For example, we were unable to analyze the difference between the buildings with income ratios above 100% and those buildings that, in prior years, had negative net operating income.
              O & M Costs of Stabilized
              Buildings by Age and Size, 1992

              Pre    Post
              All    1947    1946   11-19   20-99    100+
              -------------------------------------------
Taxes         23%     21%     29%     28%     22%     26%
Labor         13%     12%     17%      6%     11%     21%
Fuel          11%     13%      8%     13%     13%      6%
Utility       11%     11%     11%     10%     11%     10%
Maint.        19%     20%      5%     19%     20%     16%
Admin.        11%     11%     10%     11%     11%     10%
Insurance      6%      6%      4%      7%      6%      4%
Misc.          6%      7%      5%      6%      7%      6%

Total*       100%    100%    100%    100%    100%    100%

Note: Totals may not add to 100% due to rounding
To return, click here