The period 1991 to 1993 was kind to neither tenant nor landlord. The deepening recession made it impossible for many landlords to raise rents as fast as the guidelines for stabilized apartments allowed. Indeed, charges for many high rent apartments were reduced. Evidence from the Board's Income and Expense Studies also suggests that collection and vacancy losses soared, further reducing landlords' rent revenue.
Tenants fared poorly too. After a period of rising prosperity in the 80's, tenant income plummeted 10% in real terms. The median rent-to-income ratio for stabilized tenants also showed a substantial increase, from 25.8% in 1991 to 28.2% in 1993, the highest level in modern times.
As if these grim statistics were not enough, the HVS also brings to light some other discouraging trends. Income inequality, which increased substantially during the eighties, continued to grow from 1991 to 1993. Rents for low rent units increased much faster than for high rent units, thereby increasing the burden for many low income households. Finally, inequities within the rent stabilization system are distressingly high. While many long term or older tenants have secure incomes and pay very low rents, young families have been hit hard by the recession and must pay much more for housing.
Over the past few years the Rent Guidelines Board has heard an abundance of testimony from landlords regarding the impact of the long-running recession on the rental market. A number of these owners testified that market weakness had forced them to REDUCE rents, especially for high rent apartments. Other testifiers argued that the upsurge in unemployment also made it impossible to raise rents in the low end of the market. Low income tenants simply cannot afford higher rents; it would be irrational for landlords to raise rents when low income tenants cannot pay.
The new HVS data shows that the recession has restrained rent increases. Overall, rents charged by landlords failed to keep pace with the increases authorized by the RGB between 1991 and 1993. However, weakness in the market has been almost entirely confined to the high rent sector. Rent increases for mid- and low-rent units have been substantial, despite declining tenants' income.
The mean average rent for stabilized units increased from $554 in 1991 to $593 in 1993, or 7%. For apartments which were rent stabilized in both 1991 and 1993 the increase was only 6.6%.(1)
Although the increase in the mean average rent outpaced the Consumer Price Index, it lagged behind increases authorized by the Rent Guidelines Board. The RGB's orders allowed a 7.7% increase in aggregate rent between the Spring of 1991 and the Spring 1993, whereas actual rents rose only 6.6%.(2)
At first glance the 1.1% difference between the two figures may seem slight, or even insignificant. However, it should be noted that the increase measured by the HVS includes rent hikes NOT authorized by the RGB (i.e. individual apartment increases and major capital improvements allowed by the DHCR). Thus the deficit between RGB sanctioned rent increases and those imposed by landlords is actually somewhat greater than 1.1%. Clearly, the recession made it impossible for some landlords to increase renewal leases by the full amount of the guidelines or to charge a vacancy allowance.
Average rents rose faster in the older portion of the stock than in the newer. The mean average rent for Post '46 units was up only 5.8%, while the Pre-war average rose 7.1%.(3)
In the boroughs, rent increases were inversely correlated with economic well-being. The Bronx had the greatest increase in rents (8.5%), followed by Brooklyn (6.9%), Manhattan (5.9%) and Queens (5.5%).
The difference between rent increases in affluent and poor neighborhoods was particularly striking in Manhattan. While a high income area like the Upper East Side recorded a 4% increase, rents in Washington Heights rose 12%. In the six southern Manhattan subboros (i.e. the so-called "Manhattan Core") mean rents rose approximately 5% while the comparable figure for the four northern Manhattan subboros was 11%.
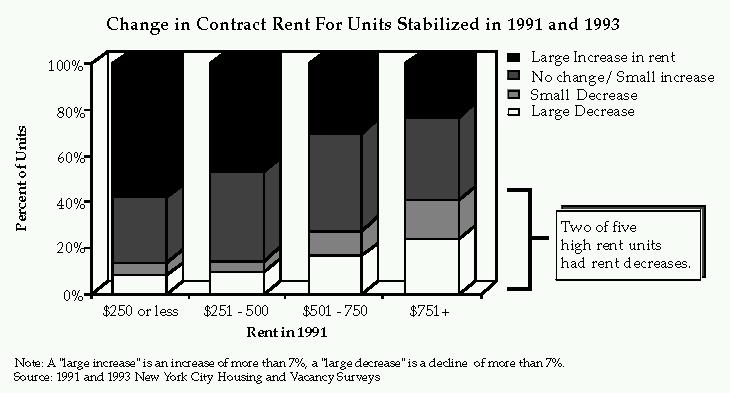
If rents tended to rise faster in poorer neighborhoods, did low rent units record larger rent increases than high rent units? The chart Change in Contract Rent for Units Stabilized in 1991 and 1993 affirms the question - rents increased much faster in the low rent stock than in the high rent stock. Less than 15% of units with rents of $500 or less in 1991 recorded rent decreases compared to about 40% of units in the highest rent category. Conversely, less than 30% of the units in the upper rent categories had "large" rent increases while approximately 50-60% of the least expensive apartments recorded substantial increases.(4)
This data confirms much of the testimony of building owners and managers heard by the RGB during the last two guideline "seasons." It is clear that the recession DID make it very difficult to raise rents for apartments in the mid- to upper end of the rent distribution. The HVS figures also tend to rebut the assertion that landlords would not raise rents on low rent units because tenants simply couldn't afford to pay the increases. The overwhelming majority of low rent units posted rent increases. Many of these increases were substantial. Without additional information it is impossible to say if these increases were actually collected. Thus the "affordability" of these increases remains in question. Evidence of recent increases in collection losses suggests that some proportion of rent hikes may not have been collectible.
In the beginning of this report we showed that the mean average rent for units stabilized in both 1991 and 1993 increased 6.6%. We have also demonstrated that many rents in the upper part of the rent distribution were reduced between 1991 and 1993. Given these rent reductions, how was it possible for rents overall to increase at nearly the pace that RGB guidelines allowed?
One possibility is that landlords charged greater increases for low rent units and for recent movers (i.e. renters who moved between 1991 and 1993). To examine this possibility we separated apartments which were rent stabilized in 1991 and 1993 into four groups:
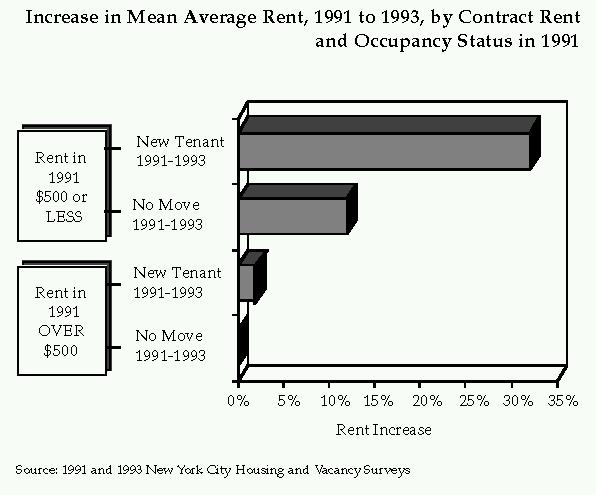
Changes in the average rent for these categories are illustrated in the chart Increase in Mean Average Rent, 1991 to 1993, by Contract Rent and Occupancy Status in 1991. As a group, apartments renting for MORE than $500 in 1991 saw an increase in rent of only 1% between 1991 and 1993. Although rents paid by recent movers rose slightly, there was no overall increase in rent for non-moving households.
By contrast, increases were substantial for units which rented for $500 or LESS in 1991. The mean rent for continuously occupied units rose about 12%. The contract rent for newly rented apartments increased by nearly a third.
Another way to look at this data is to break down the increase in landlords' aggregate rent charges between 1991 and 1993 by type of unit. More than 90% of landlords' increased revenue came from apartments renting for $500 or less in 1991. Although tenants remaining in place shouldered most of the increase, recent movers paid a disproportionate share. While recent movers constituted about 30% of stabilized renters, they paid about 40% of the increased rent.
See chart Mean Average Contract Rent in 1993 by Year Moved Into Apartment, Rent Stabilized Units
The mean income of rent stabilized households decreased by 3% between 1990 and 1992.(5) In inflation adjusted dollars the decrease was 10%, the sharpest decline since the early 70's.
It is clear that a deep recession and the accompanying increase in the unemployment rate were responsible for most of the decline in tenant incomes. In 1990 the unemployment rate was 6.8%. Two years later it stood at 10.8%. The large increase in unemployment had a disproportionate impact on households with two or more wage earners.
Not all of the drop in income was due to the worsening economy. Shifts in the demographics of the rent stabilized population also played a part. The most remarkable change was a substantial decrease in the percentage of households with two or more adults but no children, the household type with the highest mean income. We estimate that changes in demographics and in the types of households which reported income accounted for about 40% of the drop in inflation adjusted income. If these factors had stayed constant in the 1991 and 1993 HVS surveys, the real income decline would have been only 6%, rather than 10%.
Given the severity of the most recent recession, few household types were better off in 1993 than in 1991. Even so, some types of households fared better than others. The relative "winners" included households with significant non-employment income (e.g. the single elderly), households with older breadwinners, and households in the top 25% of the income distribution. The "losers" included younger families and those near the bottom of the income distribution.
For many single elderly persons social security is a primary source of income. Social security benefits have been indexed to the Consumer Price Index for some time, so it is understandable that single elderly households fared relatively well during the recession. Their inflation adjusted income decreased by only 2%.
See chart Decrease in Mean Average Income (Constant Dollars) by Age of Householder, 1990-92
Households categorized as "Adult" households (i.e. two or more adults with a non-elderly head, no children) fared the worst, with a real income decrease of about 8%. Adult households are more likely than any of the other household types to include two wage earners. On average, they are also the most affluent of all households.
The recession was particularly cruel to younger households (ages 18 to 29), who lost nearly 20% of their income in the two year period. By contrast, householders aged 45 to 61 suffered a decrease of only about 1%. In the case of younger households, one suspects that unemployment played a major role. The old dictum "last hired, first fired" probably still holds true.
In last year's report on the 1991 HVS we showed that low income households lost ground during the 80's - the constant dollar income of these households fell. In addition, since the "higher income groups did well during the eighties."(6) income inequality increased, leaving poor families worse off in relative terms as well.
Both low and high income households lost ground over the two years. The 25% of households with the highest incomes fared best; their constant dollar income declined by about 5% during the two year period. The poorest households fared next best, probably due to a high proportion of single elderly households who had relatively stable incomes. Worst off were low to moderate income households (i.e. those in the second income quartile) whose income fell by approximately 12%. Since high income households lost less ground than low or moderate income households, income inequality increased in the stabilized sector, continuing the pattern of the 80's.
In general, the richer boroughs fared better than the poorer during the most recent recession. In the Bronx, the city's poorest borough, real income of stabilized renters declined 11%. The decrease in Brooklyn (the second poorest borough) was 9%, while Manhattan renters' income (the most affluent) fell by only 3%. The sole exception to this correspondence between affluence and changes in income was in Queens. Inflation adjusted income in Queens plummeted 13%.
These patterns are also apparent in levels of poverty and public assistance. While poverty levels were fairly stable in Manhattan, the other boroughs experienced double-digit increases. The percentage of households receiving public assistance rose only 7% in Manhattan compared to 25 to 33% in the other boroughs.
Why is it that stabilized renters in Manhattan fared so well? Two factors were certainly at work. As we showed earlier, affluent households suffered less from job cutbacks and other recession induced maladies. Manhattan has a very high share of the city's affluent renters. Demographics also played a role. In Manhattan about two-fifths of renters are single individuals, compared to about one-fifth in the outer boroughs. Single adults lost less ground during the recession than households with multiple wage earners.
The substantial drop in income in Queens is harder to explain. It is true that Queens has the highest percentage of households with two or more adults, but this cannot be entirely responsible for the large drop in income. Other, as yet undiscovered factors must also have been at work.
In the city's community districts, it is difficult to make generalizations about changes in income. In general, affluent areas in Manhattan and Brooklyn appear to have gained ground or at least lost little. Inflation adjusted income fell in many low income neighborhoods throughout the city.
One would expect a sharp decline in real incomes to produce a corresponding increase in households living below the poverty level. Such an increase did occur, as the percentage of stabilized households living below the poverty level rose from 24.6% in 1990 to 27.2% in 1992. This 1992 figure establishes a new high for the percentage of stabilized households below the poverty line.
Poverty levels increased for all types of households, with the sole exception of the single elderly. Increases were particularly large for households with two or more adults but no children. The percentage of households below the poverty level also increased for all age groups. Once again, the elderly were affected the least as poverty levels grew only slightly.
The increase in joblessness and poverty forced many stabilized households onto the welfare rolls. The percentage of households receiving public assistance jumped from 18.4% in 1991 to 22.3% in 1993, an increase of more than one-fifth. Single parents with children fared particularly poorly. In 1991 slightly over half of these households were receiving public assistance, but by 1993 the figure was closer to two-thirds.
In previous sections of this report we showed that current dollar incomes of rent stabilized tenants fell while contract rents continued to increase. The inevitable outcome was a decrease in housing affordability. The median contract rent to income ratio increased from 25.8% in 1991 to 28.2% in 1993. Another measure of tenant burden, the aggregate share of tenant income spent on rent, increased from 22.2% to 24.5%.
Although tenants paid substantially more income on rent in 1993 than in 1991, the increase in the rent burden was not shared equally by all income classes. While the average rent to income ratio for the bottom three income quartiles rose substantially, the highest income quartile (e.g. the fourth of renters with the highest incomes) saw virtually no change in their rent burden. For these renters a decrease in income was matched by a decrease in rents, thereby keeping the proportion of income spent on rent nearly unchanged.
Renters in Manhattan fared much better than tenants in the outer boroughs. Increases in rent were smaller in Manhattan, as were decreases in income. As a result, the rent to income ratio grew about half as fast as in the rest of the city.
The effect of the recession on younger households' finances was particularly severe. The rent-to-income ratio of household heads aged 18-29 rose from 26% to 31% in two years, by far the largest jump. Among the household types, single adults with children had the greatest increase in rent burden while the increase for the elderly was the smallest. Once again, the middle-aged and elderly fared much better than younger households.
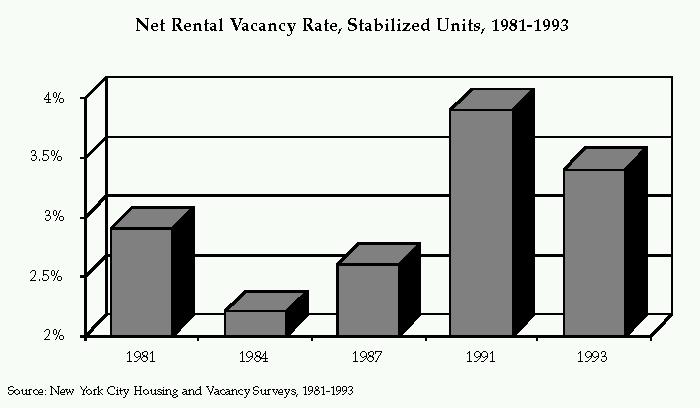
The overall rental housing vacancy rate decreased from 3.8% in 1991 to 3.4% in 1993. In the rent stabilized sector the decline in the vacancy rate was slightly greater - from 3.9% in 1991 to 3.4% in 1993.(7) All of the decrease in vacancies occurred in the Pre '47 stock; the vacancy rate in the Post '46 sector remained unchanged.(8)
See chart Net Rental Vacancy Rate, Stabilized Units, 1981-1993
The decline in the overall vacancy rate was due entirely to a sharp reduction in the number of empty Manhattan apartments. In 1991 the vacancy rate in Manhattan was 5.0%. Two years later it had fallen to 3.5%. In the outer boroughs both the number of vacancies (21,000) and the rate (3.3%) were identical in both years.
Given recent economic conditions it would be natural to suspect that most of the drop in Manhattan vacancies was in the high rent stock, which had become unaffordable. However, this was not the case. Although the number of units with asking rents of $1000 or more did decrease from 1991 to 1993, there was also a substantial reduction in the number of low and moderate rent units available for rent.
It appears that two separate trends may have been at work to decrease the Manhattan vacancy rate. As the recession made housing less affordable, the lowest rent units disappeared from the market - the number of available units with asking rent of less than $500 was nearly halved from 1991 to 1993. In addition, it appears that landlords probably reduced asking rents for the highest rent units.
In an earlier portion of this report we showed that a significant proportion of renter occupied units had rent reductions. The same forces were certainly at work in the market for vacant units, as the mean average asking rent in Manhattan declined from approximately $850 in 1991 to $810 in 1993.
As we have seen, the rental market tightened slightly from 1991 to 1993. Fewer vacant units were available to prospective renters. The decline in available units was due entirely to a drop in the number of empty Manhattan apartments. The decline in vacant apartments in Manhattan was a function of the relative stability of renters' incomes in that borough and somewhat reduced asking rents.
How affordable were the asking rents of apartments in 1993 compared to offerings two years earlier? The simplest way to measure affordability is to compare the average asking rent with the average tenant's income. Using the median rent and income, affordability declined slightly. Substituting the mean tenant income and the mean asking rent, affordability improved slightly. In short, the results are ambiguous and do not indicate much change in affordability.
Another way to approach the question is to compare the distribution of asking rents for vacant units with rents actually paid by existing tenants, using rent quartiles.(9) This method enables us to measure the disparity between asking rents and rents actually paid by tenants.
In 1991 about 41% of units for rent had asking rents in the top quartile (versus 25% of occupied units), indicating that asking rents were running far ahead of rents for occupied units. In 1993 the figure for the top quartile had declined to 31% - far fewer high rent units were available. The rent distribution of vacant units had become much more like the distribution for occupied units.
While the number of high rent units for rent declined substantially from 1991 to 1993, the number of low and moderate rent units was unchanged. From the perspective of low and moderate income households the market looked fairly similar in 1991 in 1993, if slightly less affordable. For high income renters in 1993 there were fewer units to choose from. However, it seems likely that other high income renters benefited from declining rents in the intervening years.