Note: On November 3, 1995, the New York City Department of Housing, Preservation and Development (HPD) released their "Housing New York City 1993" report which is also known as the "Housing Vacancy Survey" or "HVS". This work is a public document mandated by law and may be obtained as described below. At this time TenantNet is providing the ten page press release describing the major findings and conclusions of the report as well as the table of contents. We are hoping to eventually provide the full text of the 508 page report. This information is provided as it was supplied by HPD and we are, at this time, making no comment on the report, its data or findings.
PRESS OFFICE FOR IMMEDIATE RELEASE: CONTACT: Colleen Roche: 788-2958 Date: November 3, 1995 Deborah Boatright, HPD (212) 386-5600
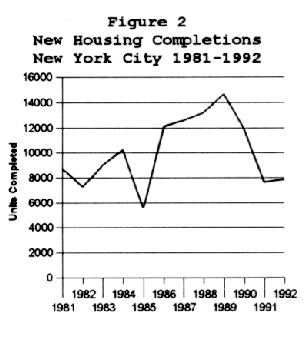
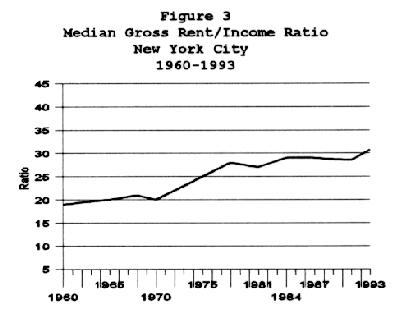
MAYOR GIULIANI AND HPD COMMISSIONER WRIGHT ANNOUNCE THE RELEASE OF HOUSING NEW YORK CITY 1993 REPORT 508-Page Report, Based on U.S. Census Bureau's Comprehensive "1993 New York City Housing and Vacancy Survey," Examines State of NYC's Housing Stock, Provides Residential Population Data New York City, November 3, l995 --- Mayor Rudolph W. Giuliani and Department of Housing Preservation and Development (HPD) Commissioner Deborah C. Wright today announced the release of Housing New York City 1993, a comprehensive analysis of New York City's housing stock, residential population, and many other housing-related issues and trends. The 508-page report, written by Dr. Anthony Blackburn, is the eleventh in a series of reports that interprets data collected by the U.S. Census Bureau in its "New York City Housing and Vacancy Survey," which was most recently conducted during 1993. In addition to fulfilling legal requirements, which include estimating the vacancy rate for rental housing, reporting on the supply and condition of housing, and documenting the need for continuing the control and regulation of residential rents in New York City, the Report also presents and analyzes data regarding the City's overall population and the changing patterns of rents, household incomes, rent-to-income ratios, employment, and other characteristics of NYC's housing market. Key Findings of the Housing New York City 1993 Report Include: 1. The number of dwelling units in 1993 was almost 3 million, of which over 2 million were rental units. Home ownership levels increased over the 12-year period from 1981 to 1993, from 27.8% to 29.0%. Despite this increase, New York remained largely a "renter" City. 2. Overall housing conditions throughout New York City improved between 1991 and 1993 despite the continuing recession, led by the Bronx. Observed building defects declined from 14.0% to 10.7% of all buildings citywide in which units were surveyed. In addition, the percentage of units with five or more maintenance and equipment deficiencies decreased. Since 1970 the dilapidation rate in rental housing has dropped dramatically. The City's rehabilitation programs, including low-interest loans to private owners and J-51 tax abatement programs were a major factor in this improvement in housing conditions. See Figure 1 3. Between 1991 and 1993, New York City, along with its private partners, were responsible for returning 8,000 units annually to the inventory, through the gut rehabilitation of over 14,000 units and moderate rehabilitation of over 2,000 formerly uninhabitable vacant units in City-owned (in rem) buildings. Nevertheless, new housing completions declined dramatically from a peak in 1989. See Figure 2 4. The Net Rental Vacancy Rate in 1993 was 3.44%, the second highest rate ever reported since the initial Census Bureau survey was taken in 1965, down slightly from its highest rate of 3.78% in 1991. However, the 1993 rate is still well below 5.00%, which means that a housing emergency exists and that the New York City Council has the legal authority to continue to approve rent control and rent stabilization laws. 5. Between 1991 and 1993, the median contract rent for all occupied rental units in New York City increased from $475 to $501 in current dollars, an increase of 5.5%. Over the same period, the Consumer Price Index increased by approximately 7.5%, meaning that in real terms the median contract rent actually declined by 1.8% between 1991 and 1993. 6. The incidence of crowding in New York City apartments remained a problem in 1993, but stayed at about 10%, approximately the same level as in 1991. The rates of crowding and severe crowding were highest for the pre- 1947 stabilized and in rem (City-owned) inventories. Rent-controlled units were the least likely to be crowded. The number of single persons with minor children who were living "doubled up" with other households grew by 22% between 1991 and 1993, a disturbing finding as this group is considered to be at high risk for homelessness. 7. According to the 1991 and 1993 Housing and Vacancy Surveys (HVSs), the median household income for all NYC households declined by 4.2%, from $24,000 in 1990 to $23,000 in 1992. During the same two-year period, the Consumer Price Index rose 8.3%. Thus, "real incomes" (adjusted for inflation) declined by 11.5%, or by an average annual compound rate of 5.9%. (1990 income estimates were not available for 26.4 percent of all households; 1992 income estimates were not available for 29.4 percent of all households. HVS income data should be interpreted in light of this non-response rate.) 8. Almost a quarter of all NYC households reporting 1992 income fell below the federal poverty threshold for families in 1992, an increase of 3.2% over the 1990 poverty rate. The poorest tenants continue to be those who live in public (NYCHA) and in rem (City-owned) housing. The 1992 median annual income of public housing tenants was $7,800; for in rem tenants, $6,420. 9. Over the 10-year period between 1981 and 1991, the median gross rent-to-income ratio was very stable. However, between 1991 and 1993, the median rent-to-income ratio grew rapidly, gaining 2.3 percentage points, to 30.8%. See Figure 3 Beginning with the Local Emergency Housing Rent Control Act of 1962, and the subsequent Local Rent Stabilization Law of 1969 and Emergency Tenant Protection Act of 1974, New York City was charged with determining that a "housing emergency" exists as a condition for continuation of rent control and stabilization laws. In order to fulfill these responsibilities, New York City has retained the U.S. Census Bureau to conduct a comprehensive survey of the New York City housing market since 1965. The U.S. Census Bureau conducted household interviews at a sample of some 18,000 housing units in the City between late January and May of 1993. The Housing New York City 1993 Report was prepared by Dr. Anthony Blackburn, President of Speedwell, Inc., a Massachusetts-based consulting firm, supported by HPD staff. Dr. Blackburn received his Ph.D. in economics from the Massachusetts Institute of Technology and taught at Harvard University. The Report can be purchased at the City Books Store, at 61 Chambers Street in lower Manhattan, for $30 plus tax. For mail orders, checks for $35.18 (includes shipping and handling) should be sent to City Books, Room 2223 Municipal Building, 1 Centre Street, New York, New York 10007. For the first time, a color map of New York City showing the boundaries of boroughs, sub-borough areas, community districts, census tracts and major streets has been prepared by the U.S. Census Bureau for HPD. It can be purchased at City Books for a total of $16.24, or $18.40 for mail orders (includes shipping and handling). The attached exhibit is a chapter-by-chapter summary of additional findings from the Housing New York City 1993 Report. # # #
EXHIBIT TO NOVEMBER 3, 1995 MAYOR'S OFFICE PRESS RELEASE RE: RELEASE OF HOUSING NEW YORK CITY 1993 REPORT CHAPTER-BY-CHAPTER SUMMARY OF ADDITIONAL FINDINGS The Residential Population of New York City (Chapter 2) o According to the 1991 and 1993 HVSs, New York City's population living in households was 7,145,000 in 1991 and 7,118,000 in 1993. o Most of the population decrease between 1991 and 1993 occurred among non-Hispanic whites and Puerto Ricans. The white population has declined from 53% of the total population in 1981 to 40% in 1993. The Puerto Rican population declined from 12 percent to 11 percent of the total population between 1981 and 1993. The fastest growing racial and ethnic populations, besides "Others", were Asians, with an annual growth rate of 4.3%, and non-Puerto Rican Hispanics (3.7%) between 1991 and 1993. Household Incomes in New York City (Chapter 3) o According to the 1991 and 1993 HVSs, the decline in median income between 1990 and 1992 almost entirely offset the modest growth in median income that had taken place between 1980 and 1990, so that real median household income was almost exactly the same in 1992 as it had been in 1980. Although the real income of owner households increased somewhat over the 1980-1992 period, the real income of renter households was lower in 1992 than 12 years earlier. (As noted in Key Finding 7, income data was not reported for 1990 by 26.4 percent of all households and for 1992 by 29.4 percent of all households.) Median Household Income for Renters (Constant 1992 Dollars): 1980 1990 1992 $19,732 $21,661 $19,005 See Figure 4 o Between 1980 and 1992, the real median household income of those in the top fifth of the income distribution increased by almost 16%, while the median income of those in the bottom fifth declined by 23%. Tenants in rent-controlled units had median incomes of $14,400, well below the overall 1992 median income for renters of $19,005. The median income of rent-stabilized tenants was $20,150. Tenants with the highest incomes lived in unregulated units, where the median household income was $25,000. In unregulated rental units in coops and condominiums, median household income was $36,000. o It is estimated that in 1993, 65% of New York City's renter households would have qualified for federal housing assistance as Lower Income families, and that 47% of renter households would have qualified as Very Low Income. The total number of households living in directly subsidized housing or receiving rental assistance payments was approximately 414,000, or just over a quarter of all income-eligible households. o The median income of all NYC households with incomes below the federal poverty threshold was $6,000. Fewer than 30% of these householders were in the labor force and almost two-thirds were headed by single females. The median income of poor single female households was $5,964; they were more likely to be living with a minor child, less than 45% had completed high school, and only 21% were in the labor market. o Cash public assistance was paid to 17.5% of all New York City households in 1992, up from 14.7% two years earlier. The 1992 median income of public assistance households was $6,957. o Approximately three-fifths of public housing households and over two-thirds of in rem households were poor. Half of all public housing households and almost two-thirds of all in rem households were on public assistance. Less than half of all public housing and in rem householders had graduated from high school, and less than 40% were in the labor force. For those in the labor force, unemployment rates were extremely high. New York City's Housing Inventory (Chapter 4) o In 1993, there were almost three million dwelling units in the City, a total essentially unchanged since 1991. Of this total, over two million (69%) were rental units, 827,000 (28%) were owner units, and the remainder were units that were vacant but unavailable for either sale or rental. o There were about 2,047,000 occupied and vacant available rental units in the City in 1993. Of these, about 1,013,000 were rent- stabilized units, 102,000 were rent-controlled units, 139,000 were "other" regulated units, 582,000 were unregulated (486,000 in rental buildings and 95,000 in coop and condo buildings), 175,000 were public housing units, and 36,000 were in rem (City-owned) units. The rent-controlled housing inventory has dropped by 184,000 units since 1981. o The number of unregulated coop and condo rental units increased by almost 34,000, or 55%, between 1991 and 1993. o Annual new housing completions, which had declined to about 7,200 units at the depth of the recession in the early 1980's, increased markedly through 1989, when they reached almost 14,700 units. Thereafter, the construction rate declined sharply to below 8,000 per year in both 1991 and 1992, approximating the new construction rate during the previous recession. o Between 1991 and 1993, average annual inventory losses were 19,000. This figure is higher than the roughly 14,000 units lost annually during the mid-1980's, but still substantially lower than the 23,000 to 27,000 units lost annually during the late 1970's and early 1980's. Housing Vacancy Rates (Chapter 5) o The 1993 vacancy rate for units renting for less than $300 per month was 0.58%. For units renting below $500 per month -- which account for nearly 45% of all rental housing units reporting -- the rate was 1.10%. For units renting for $700 or more, the vacancy rate was 5.33%. See Figure 5 o The sharpest decline in vacancy rates between 1991 and 1993 was found at the lowest and highest rent ranges. For units renting for less than $300 per month, the vacancy rate fell from 1.19% in 1991, to 0.58% in 1993. For units renting for $900 or more, the rate fell from 7.92% (1991) to 5.50% (1993). o The 1993 vacancy rate for unregulated rental units in cooperative or condominium buildings (10.58%) was much higher than the vacancy rate for unregulated rental units in rental buildings (3.98%). New York City's Rent Levels (Chapter 6) o Between 1991 and 1993, the real median contract rent (adjusted for inflation) increased by 6.4% for rent-controlled units and by 1.7% for rent-stabilized units, but decreased by 0.8% for unregulated units, by 5.6% for public housing units and by 7.1% for in rem units. o On average, contract rents doubled between 1991 and 1993 for units which were rent controlled in 1991 but subsequently turned over and became rent stabilized. The average nominal (not adjusted for inflation) rent increase for units which were stabilized in both years but had turned over was 19%, while the average nominal rent increase for unregulated units which had turned over was 13%. o Over a quarter of rent-stabilized units which turned over and almost a third of unregulated units which turned over experienced decreases in nominal rents between 1991 and 1993. o Almost a quarter of all stabilized units which turned over between 1991 and 1993, where the 1991 residents had been there since 1981 or earlier, had a rent increase of 80% or higher between 1991 and 1993 . This does not necessarily imply, according to the Report's author, that stabilized rents were raised illegally, because owners may raise rents above rent guideline s under the Major Capital Improvement and Individual Apartment Improvement Programs administered by the State's Division of Housing and Community Renewal. Taken together, the high incidence both of rent decreases and rent increases in excess of rent guidelines suggests that a substantial portion of the rent-stabilized inventory may not have been constrained by rent guidelines between 1991 and 1993. o Unregulated units had the highest median contract rent in 1993, at $640 per month. Rent-stabilized units had the next highest median rent ($525), followed by rent-controlled ($366), in rem ($250) and public housing ($203) units. o Approximately two-thirds of public housing and in rem units, and three-eighths of rent controlled units rented for below $300 per month in 1993. Only 10% of stabilized units and fewer than 4% of unregulated units rented in this range. Housing Conditions in New York City (Chapter 7) o The number of renter-occupied units in dilapidated buildings in 1993 was approximately 23,000. This number, and the associated 1.2% dilapidation rate, were essentially unchanged from 1991, notwithstanding the influence of the recession. o The incidence of building defects for older units, controlled and pre-1947 stabilized, was above the City-wide rate in 1993. The incidence of building defects for in rem units was over four times the City-wide rate for renter-occupied housing. o In both 1991 and 1993, the incidence of "crowding" (defined as more than 1.0 person per room) was 10%, and the incidence of "severe crowding" (defined as more than 1.50 persons per room) was approximately 3.5%. These rates are very high relative to the nation as a whole: in 1991, some 6% of renter households in all U.S. central cities were crowded, and only 1.7% were severely crowded. However, the stability in New York City's crowding and severe crowding rates between 1991 and 1993 followed a very rapid increase over the preceding four years. o The incidence of renter-occupied units on the same street as buildings with broken or boarded-up windows fell sharply City-wide. In 1981, 23.3% of occupied units had such buildings on the same street; 10 years later, the incidence was 15.7%, and by 1993, it had fallen to 13.7%. The decline was sharpest in the Bronx, dropping from 31.1% in 1981 to 9.2% in 1993. See Figure 6 o Three out of five renters rated the physical condition of residential structures in their neighborhood as either "Good" or "Excellent." o Non-Hispanic white renter households were much better off than renter households of all other racial/ethnic groups in terms of physical housing condition. Asian renter households scored next highest after white renter households on all measures of housing conditions except crowding. A quarter of all Asian renter households were crowded, easily the highest crowding rate of all racial/ethnic groups and almost six times the crowding rate of white renter households. Housing Market Outcomes (Chapter 8) o Renter households in rent-controlled housing had lower median gross rent-to-income ratios than renter households of comparable incomes in rent-stabilized housing. Renter households in rent-stabilized housing had a lower median rent-to-income ratio than renter households of comparable incomes in unregulated units. The overall median rent-to-income ratios were essentially the same for each regulatory category because lower-income households were more heavily represented in the less expensive categories of rental housing, and higher-income households were more heavily represented in the more expensive categories of rental housing. o Households with less than $10,000 in annual income living in "other" regulated and public housing units had median rent-to-income ratios that were lower than any other rental housing category. Tenants of in rem units, with less than $10,000 in annual household income, had a lower median rent-to-income ratio than those in stabilized and unregulated housing units, although it was not as low as for tenants in this income group living in rent-controlled units. o In rem housing, where over two-thirds of the tenants had incomes below $10,000, had the highest percentage of "poor households" (defined as households with incomes below the federal poverty level), followed by public housing, where over 58% had incomes below $10,000, and "other" regulated housing, where over 45% had incomes below $10,000. o Over 76% of renter households on public assistance paid a contract rent that exceeded the shelter allowance. The mean shelter allowance deficit for public assistance renter households in privately owned housing was $180 per month, ranging from $70 in rent-controlled housing to $170 in rent- stabilized housing and $271 in unregulated housing. The mean deficit amount for all units with shelter-allowance deficits was $236 in 1993, up 24% from the 1991 deficit amount of $190. # # #
Table of Contents Acknowledgments. . . . . . . . . . . . . . . . . . . . . . . . .i Table of Contents. . . . . . . . . . . . . . . . . . . . . . .iii List of Figures. . . . . . . . . . . . . . . . . . . . . . . viii List of Tables . . . . . . . . . . . . . . . . . . . . . . . xiii List of Maps . . . . . . . . . . . . . . . . . . . . . . . .xxxii Housing New York City 1993: Report Summary . . . . . . . . . . .1 Introduction. . . . . . . . . . . . . . . . . . . . . . . .1 The Residential Population of New York City . . . . . . . .1 Household Incomes In New York City. . . . . . . . . . . . .4 New York City's Housing Inventory . . . . . . . . . . . . .6 Housing Vacancy Rates . . . . . . . . . . . . . . . . . . .8 New York City Rent Levels . . . . . . . . . . . . . . . . 10 Housing Conditions in New York City . . . . . . . . . . . 11 Housing Market Outcomes . . . . . . . . . . . . . . . . . 14 Chapter 1: Introduction . . . . . . . . . . . . . . . . . . . 19 Overview. . . . . . . . . . . . . . . . . . . . . . . . . 19 Survey Design Elements and Sample Size. . . . . . . . . . 20 Presentation and Interpretation of Statistical Findings . 20 Report Contents . . . . . . . . . . . . . . . . . . . . . 22 Chapter 2: The Residential Population of New York City. . . . 23 Introduction. . . . . . . . . . . . . . . . . . . . . . . 23 Individuals . . . . . . . . . . . . . . . . . . . . . . . 24 Racial/Ethnic Composition of the Population. . . . . 25 Age Composition of the Population. . . . . . . . . . 28 Locational Distribution of the Population. . . . . . 29 Gender Breakdown of the Population . . . . . . . . . 32 Educational Attainment of the Population . . . . . . 33 Singles, Couples, and Household Formation . . . . . . . . 39 Singles without Children . . . . . . . . . . . . . . 41 Singles with Children. . . . . . . . . . . . . . . . 42 Couples without Children . . . . . . . . . . . . . . 43 Couples with Children. . . . . . . . . . . . . . . . 44 Singles/Couples and Household Formation. . . . . . . 46 Households. . . . . . . . . . . . . . . . . . . . . . . . 52 Household Size . . . . . . . . . . . . . . . . . . . 55 Immigrant Households . . . . . . . . . . . . . . . . 58 Household Types. . . . . . . . . . . . . . . . . . . 66 Chapter 3: Household Incomes in New York City . . . . . . . . 71 Introduction. . . . . . . . . . . . . . . . . . . . . . . 71 Household Incomes . . . . . . . . . . . . . . . . . . . . 72 Changes in Household Income. . . . . . . . . . . . . 72 The Distribution of Household Incomes. . . . . . . . 74 Distribution of Household Incomes by Tenure. . . . . 76 Geographic Variation in Household Income . . . . . . 78 Median Incomes by Regulatory Status. . . . . . . . . 80 Variation in Household Income by Race/Ethnicity. . . 82 Household Income by Household Size and by Number of Employed Persons . . . . . . . . . . . . . . . . . . 87 Household Incomes by Household Type. . . . . . . . . 89 Sources of Household Income. . . . . . . . . . . . . 92 Incomes of Primary and Secondary Singles and Couples. . . 98 Lower and Very Low Income, Poor, Public Assistance Recipient, Public Housing/In Rem, and Recent Immigrant Households . . . . . . . . . . . . . . . . . . .99 Lower and Very Low Income Households . . . . . . . . 99 Poor Households. . . . . . . . . . . . . . . . . . .102 Households Receiving Public Assistance . . . . . . .110 Public Housing and In Rem Households . . . . . . . .111 Recent Immigrant Households. . . . . . . . . . . . .112 Labor Force Participation, Occupational and Industrial Patterns, and Unemployment. . . . . . . . . . . . . . . 113 Labor Force Participation. . . . . . . . . . . . . .113 Occupational Patterns. . . . . . . . . . . . . . . .117 Employment of New York City Residents by Major Industrial Group . . . . . . . . . . . . . 120 Unemployment . . . . . . . . . . . . . . . . . . . .122 Chapter 4: New York City's Housing Inventory. . . . . . . . .129 Introduction. . . . . . . . . . . . . . . . . . . . . . .129 Size and Composition of the Housing Inventory . . . . . .130 Components of Inventory Change. . . . . . . . . . . . . .132 New Construction . . . . . . . . . . . . . . . . . .132 Conversions. . . . . . . . . . . . . . . . . . . . .134 Losses . . . . . . . . . . . . . . . . . . . . . . .135 Returned Losses. . . . . . . . . . . . . . . . . . .136 Geographic Patterns of Housing and Housing Tenure . . . .137 Composition of the Inventory by Borough. . . . . . .141 The Rental Housing Inventory. . . . . . . . . . . . . . .143 Rental Units in Coops and Condominiums . . . . . . .146 The Owner Housing Inventory . . . . . . . . . . . . . . .150 Physical Characteristics of the Housing Inventory . . . .152 Size of Units. . . . . . . . . . . . . . . . . . . .152 Size of Buildings. . . . . . . . . . . . . . . . . .156 Structure Class of Buildings . . . . . . . . . . . .159 Chapter 5: Housing Vacancy Rates. . . . . . . . . . . . . . .165 Introduction. . . . . . . . . . . . . . . . . . . . . . .165 The Overall Net Rental Vacancy Rate . . . . . . . . . . .166 Vacancy Rates and Rent Levels . . . . . . . . . . . . . .168 The Number of Low Rent Vacancies . . . . . . . . . .175 Changes in the Median Asking Rent for Stabilized and Unregulated Vacant Units . . . . . . . . . . . 177 Vacancy Rates in Rental Housing Submarkets. . . . . . . .179 Vacancy Rates in the Boroughs. . . . . . . . . . . .180 Vacancy Rates and Regulatory Status. . . . . . . . .180 Vacancy Rates and Unit Size. . . . . . . . . . . . .182 Vacancy Rates, Structure Class, and Building Size. .183 Length of Vacancies of Vacant Units. . . . . . . . .185 Turnover of Rental Units . . . . . . . . . . . . . .186 Vacancies in the Owner Market . . . . . . . . . . . . . .188 Vacant Units Unavailable for Rent or Sale . . . . . . . .191 Chapter 6: New York City Rent Levels. . . . . . . . . . . . .197 Introduction. . . . . . . . . . . . . . . . . . . . . . .197 Changes in the Level of Rents . . . . . . . . . . . . . .198 Variation in the Size and Direction of Changes in Rent. . . . . . . . . . . . . . . . . 203 Rent Guidelines and Rent Changes for Stabilized Units. . . . . . . . . . . . . . . . 215 Variation in the Level of Rents . . . . . . . . . . . . .217 Variation in Median Rents by Regulatory Status and Location . . . . . . . . . 217 Rents and Regulatory Status. . . . . . . . . . . . .220 Variation in Rents with Unit Size. . . . . . . . . .224 Rents and Housing Condition. . . . . . . . . . . . .226 Rents in Coop and Condominium Buildings . . . . . . . . .227 Chapter 7: Housing Conditions in New York City. . . . . . . .231 Introduction. . . . . . . . . . . . . . . . . . . . . . .231 The Structural Condition of the Occupied Housing Inventory . . . . . . . . . . . . . . . . . 232 Overall Dilapidation Rates . . . . . . . . . . . . .232 Dilapidation Rates by Borough. . . . . . . . . . . .233 Dilapidation Rates and Structure Classification. . .234 Dilapidation Rates and Regulatory Status . . . . . .235 Dilapidation Rates and Rent Levels . . . . . . . . .236 Overall Incidence of Building Defects. . . . . . . .237 Incidence of Building Defects by Borough and Sub-Borough . . . . . . . . . . . . . . . . . . . . 238 Building Defects and Structure Classification. . . .240 Building Defects and Regulatory Status . . . . . . .241 Building Defects and Building Size (Rent Regulated Units). . . . . . . . . . . . . . . . . . 243 Building Defects and Rent Levels . . . . . . . . . .243 Building Defects and Dilapidation. . . . . . . . . .244 Structural Conditions of Owner Occupied Housing. . .245 The Level of Maintenance of the Occupied Housing Inventory . . . . . . . . . . . . . . . . . 246 Overall Incidence of Maintenance Deficiencies. . . .246 Maintenance Deficiencies by Borough and Sub-Borough.248 Maintenance Deficiencies and Structure Classification. . . . . . . . . . . . . . 250 Maintenance Deficiencies and Regulatory Status . . .251 Maintenance Deficiencies and Building Size (Rent Regulated Units). . . . . . . . . . . . . . . 253 Maintenance Deficiencies and Rent Levels . . . . . .253 Maintenance Deficiencies and Dilapidation. . . . . .254 Maintenance Deficiencies in Owner Occupied Housing .255 Crowding. . . . . . . . . . . . . . . . . . . . . . . . .256 The Overall Crowding Rate. . . . . . . . . . . . . .256 Crowding by Borough. . . . . . . . . . . . . . . . .258 Crowding and Rent Regulation Status. . . . . . . . .262 Crowding and Unit Size . . . . . . . . . . . . . . .263 Crowding and Doubled-Up Singles/Couples. . . . . . .263 Crowding and Household Types . . . . . . . . . . . .265 Crowding and Household Size. . . . . . . . . . . . .266 Crowding in Owner Occupied Units . . . . . . . . . .267 Neighborhood Conditions . . . . . . . . . . . . . . . . .268 Incidence of Broken or Boarded-Up Windows. . . . . .269 Ratings of Physical Condition of Residential Structures by Borough and Sub-Borough. . . . . .271 Physical Condition Ratings and Rent Levels . . . . .273 Physical Condition Ratings and Broken/ Boarded-Up Windows. . . . . . . . . . . . . . . . . 274 Neighborhood Conditions of Owner Occupants . . . . .275 Housing Conditions of Different Racial and Ethnic Groups.276 Physical Conditions and City-Sponsored Rehabilitation and New Construction . . . . . . . . . . . . . . . . . .277 Chapter 8: Housing Market Outcomes. . . . . . . . . . . . . .279 Introduction. . . . . . . . . . . . . . . . . . . . . . .279 The Affordability of Rental Housing . . . . . . . . . . .279 Overall Changes in the Affordability of Rental Housing. . . . . . . . . . . . . . . . . . . 280 Affordability and Rent Regulation. . . . . . . . . .285 Affordability of Rental Housing and Household Types.286 Affordability of Rental Housing and Race/Ethnicity .287 Contributions of Different Sectors of NYC's Housing Industry . . . . . . . . . . . . . . . . . . . . . . . . 288 Contributions by Household Income Group. . . . . . .291 Contributions by Race/Ethnicity. . . . . . . . . . .293 Contributions by Age Group . . . . . . . . . . . . .299 Housing Outcomes for Special Populations. . . . . . . . .299 Housing Outcomes by Household Type and Income Group.299 Single Person Households . . . . . . . . . . . . . .300 Single Parent Households . . . . . . . . . . . . . .303 Adult Households . . . . . . . . . . . . . . . . . .306 Adult Households with Minor Children . . . . . . . .309 Housing Outcomes for Poor Households . . . . . . . .312 Housing Outcomes for Public Assistance Recipients. .315 Housing Outcomes for Recent Immigrant Renter Households . . . . . . . . . . . . . . . . . 319 Home ownership Rates and Housing Outcomes for Owner Occupants. . . . . . . . . . . . . . . . . . . 324 Home ownership Rates. . . . . . . . . . . . . . . . 324 Housing Outcomes for Owner Occupants . . . . . . . .326 Appendix A: Sub-Borough Area Data. . . . . . . . . . . . . . . 331 Census Tracts Included in Each Sub-Borough Area . . . .360 Appendix B: 1993 New York City Housing and Vacancy Survey Glossary. .369 Appendix C: Definitions of Rent Regulation Status. . . . . . . . . 397 Appendix D: 1993 New York City Housing and Vacancy Survey: Sample Design, Estimation Procedure, Accuracy Statement, and Topcoding. . . . . . . . . . . . . . . . . . . .405 Appendix E: New York City Housing and Vacancy Survey Questionnaire 1993. . . . . . . . . . . . . . . . . . . 435 Index. . . . . . . . . . . . . . . . . . . . . . . . . . . . .457